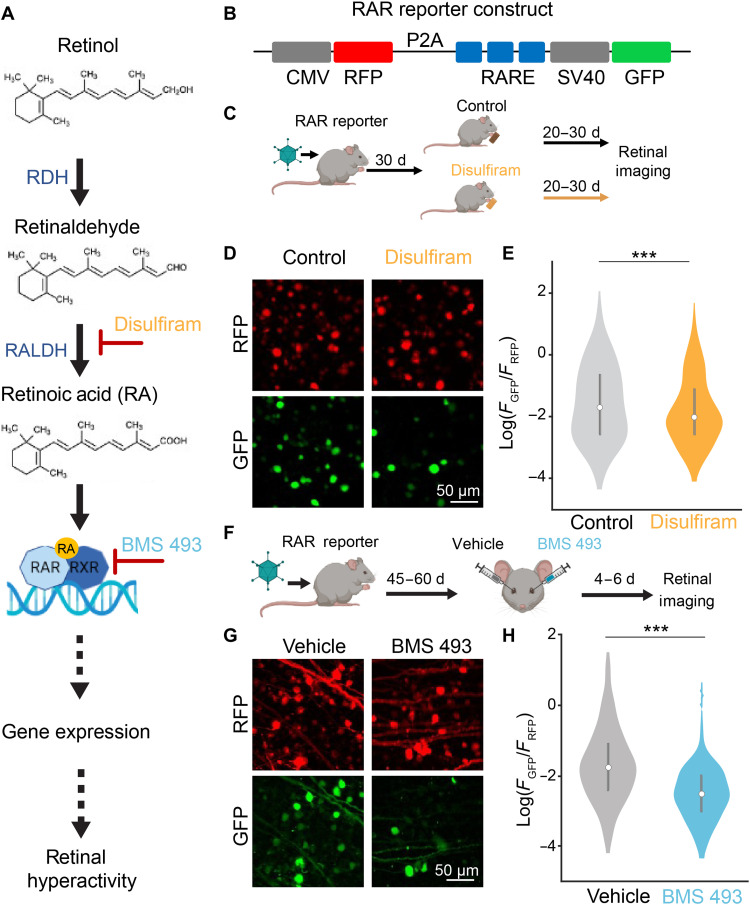
Fig. 1. Disulfiram and BMS 493 reduce signaling through the RA pathway in the degenerated retina.
(A) RA signaling pathway, including sites of intervention by disulfiram and BMS 493. RDH, retinol dehydrogenase. (B) Design of RAR reporter. CMV, cytomegalovirus promoter; RFP, red fluorescent protein; P2A, 2A self-cleaving peptide; RARE, RA response element; SV40, simian virus 40 promoter; GFP, green fluorescent protein. (C) Design of disulfiram experiment. AAV2 encoding the RAR reporter was injected into both eyes of rd10 mice at P30. Starting at P60, mice received food with disulfiram or no drug for 20 to 30 days, and retinas were obtained at P80 to P90 for imaging. (D) Flattened Z-stacks of the ganglion cell layer showing cells expressing RFP and GFP (spinning disk confocal microscopy). (E) Quantification of RA-induced expression. The value of GFP/RFP was measured for each labeled cell. The violin plot depicts the whole dataset. The bar graph shows the mean values for each experimental group ± SEM. Control: n = 733 cells from 15 retinal samples from six eyes in three mice; disulfiram: n = 535 cells from 15 retinal samples from six eyes in three mice. F(1,1266) = 12.51, ***P = 4.20 × 10⁻⁴; two-tailed F test. (F) Design of the BMS 493 experiment. AAV2 encoding the RAR reporter was injected into both eyes at P30. At 45 to 60 days later, one eye was injected with 1 μl of vehicle [phosphate-buffered saline (PBS) ×1] and the contralateral eye with 1 μl of BMS 493 (5 μM). Retinas were obtained 4 to 6 days after injection for imaging. (G) Representative images for (F). (H) Quantification of RA-induced gene expression similar to (E). Control: n = 385 cells from 15 retinal samples from eight eyes from four mice; BMS 493: n = 448 cells from 15 retinal samples from eight eyes from four mice. F(1,831) = 66.44, ***P = 1.32 × 10⁻¹⁵; two-tailed F test.

