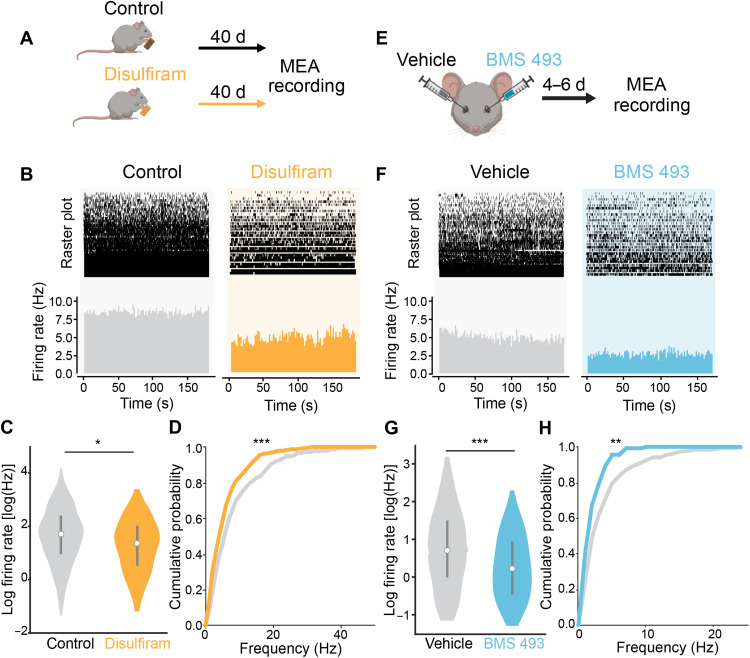
Fig. 2. Disulfiram and BMS 493 reduce hyperactivity in the degenerating retina.
(A) Early-degeneration rd10 mice (P40 to P45) were given food with or without disulfiram (2 mg/kg) for 40 days. At P80 to P85, retinas were obtained for the MEA recording of spontaneous RGC activity in darkness. (B) MEA recording from retinal samples (~15 mm2 each) from control and disulfiram mice. Raster plots show spontaneous activity of individual units. Bottom: Mean firing rates across all units. (C) Violin plots show mean firing frequency for every recorded unit. The bar graph shows means ± SEM. Control: n = 531 units from 11 retinal samples from eight eyes in four mice; disulfiram: n = 443 units from 10 retinal samples from six eyes in three mice (table S1). F(1,972) = 4.36, *P = 0.037; two-tailed F test. (D) Cumulative probability of firing frequencies from control and disulfiram retinas as in (C). Disulfiram (orange) resulted in a leftward shift in the curve, indicating reduced firing across all units (***P = 1.75 × 10⁻⁵, Kolmogorov-Smirnov test). (E) Early-degeneration rd10 mice (P40 to P45) were injected intravitreally with 1 μl of vehicle (PBS ×1) in one eye and 1 μl of BMS 493 (5 μM) in the other eye. At 4 to 6 days after injection, retinas were obtained for MEA recording as in (A). (F) Retinal MEA recordings from vehicle- and contralateral BMS 493–injected eyes from one mouse. (G) Firing frequencies similar to (C). Vehicle: n = 271 units from seven retinal samples; BMS 493: n = 135 units from six retinal samples; from a total of six eyes in three mice (table S1). F(14,404) = 20.87, ***P = 6.53 × 10⁻⁶; two-tailed F test. (H) Analysis of spontaneous activity, similar to (D). Cumulative probability plot as in (G). The left shift in the BMS 493 curve (light blue) is statistically significant (**P = 0.001, Kolmogorov-Smirnov test).

