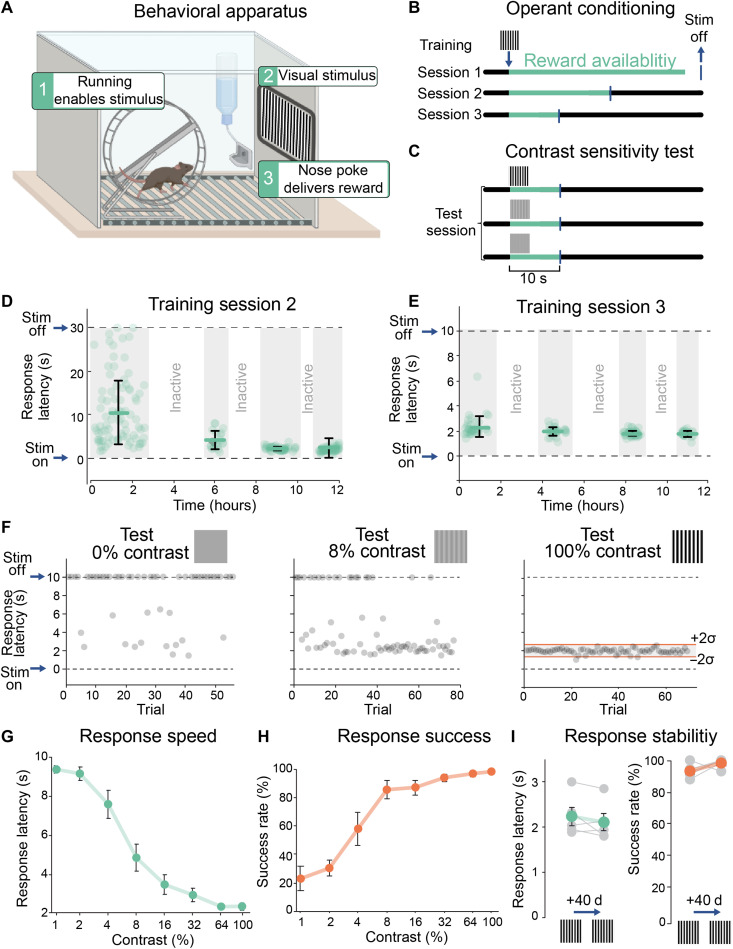
Fig. 3. Measuring behavioral image detection in mice.
(A) Apparatus for operant-conditioned image detection. Wheel running gates the display of a conditioned stimulus image associated with the availability of reward (a 10% sucrose water droplet). Reward is obtained by engaging the nose poke within the allotted reward interval. (B) Training to 100% contrast images occurs over three sessions (each 12 hours) with decreasing reward intervals, shaping response latency (table S3). (C) Contrast test was performed under the same conditions as session 3, but the visual stimulus presented was randomized between discrete contrasts from 0 to 100%. See table S3 and fig. S2. (D to F) Responses of an individual wild-type (WT) mouse during training sessions 2 (D) and 3 (E) and to three different contrasts (0, 8, and 100%) during contrast sensitivity test (F). Trials of equal contrasts were grouped for quantifying latency, although they were randomized during the test. Red lines in responses to 100% contrast show the upper and lower limits of the value range for a single trial to be considered successful (means ± 2 SD). (G) Grouped data showing full contrast sensitivity curve. The response speed (latency in seconds) plotted against the contrast of each visual stimulus (n = 5 WT mice, P60). (H) Full contrast sensitivity curve showing success rate as a function of contrast in the same group of mice as in (G). (I) Comparison of response speed and success rate in the same group of WT mice at P60 versus P100, with no training session carried out between the two time points. Individual data for each mouse are shown in gray; mean ± SEM values are shown in green (latency) and red (success rate), respectively. P > 0.05, Wilcoxon rank sum test.

