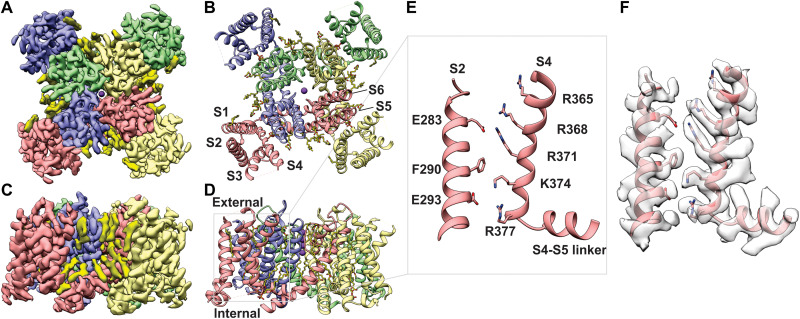
Fig. 1. Structure of the Shaker-IR Kv channel in lipid nanodisc.
(A and B) View of Shaker Kv channel model (A) and EM map (B) from an extracellular perspective. (C and D) TM side-view of Shaker-IR Kv channel model (C) and EM map (D). Each subunit is shown in different colors and EM densities that appear to be lipid molecules are colored in bright yellow. (E and F) Close-up view of a voltage-sensing domain. The S2 and S4 helices within the voltage-sensing domain highlighted with a gray box in (D) is shown without (E) and with (F) EM density.

