FIGURE 3.

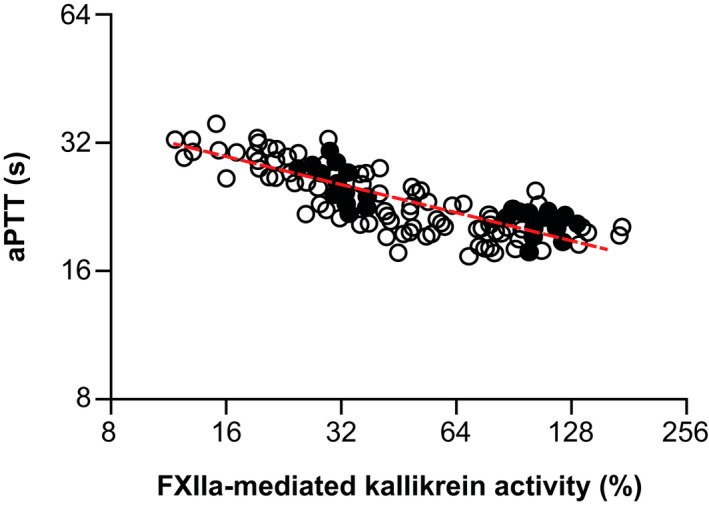
Relationship between aPTT and FXIIa‐mediated kallikrein activity data in cynomolgus monkeys, fit using linear regression. The dashed red line represents the linear regression, as determined by Equation 15. aPTT, activated partial thromboplastin time; FXIIa, activated factor XII
