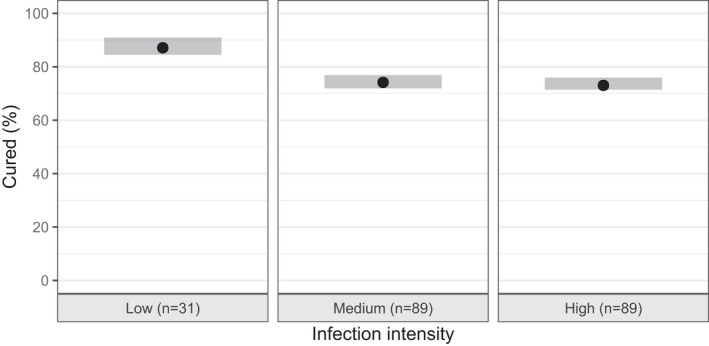
FIGURE 1.

Visual predictive check (VPC) of the exposure‐efficacy response model, showing the percentage of moxidectin (2–12 mg) treated individuals being cured split for infection intensity. Shaded area’s indicate the simulation based 95% prediction interval of the percentage being cured (n = 500 datasets), where the black dots show the observed percentage of patients being cured
