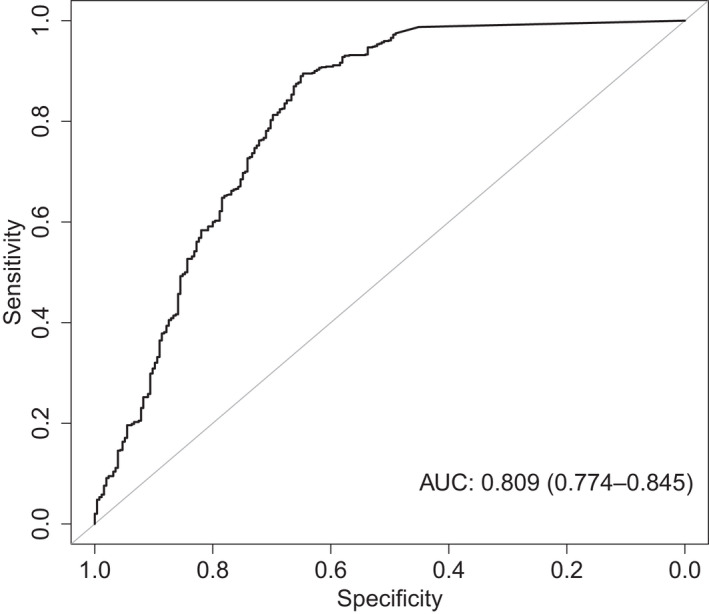
FIGURE 2.

Area under the curve of the receiver operated characteristics (AUC‐ROC) curve for the final exposure‐efficacy response model incorporating AUC0–24h and infection intensity. The AUC is shown in the figure with 95% confidence interval between brackets
