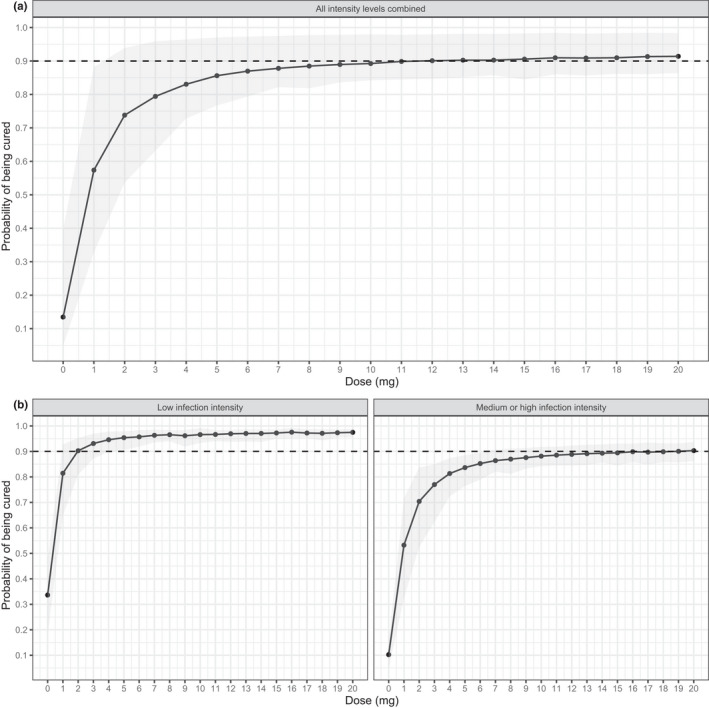
FIGURE 3.

Predicted probability of being cured for dose levels between 0 and 20 mg, based on Monte Carlo simulations (n = 10,000) using the final exposure‐efficacy response model with AUC0–24h as exposure metric (Table 1) where parameter uncertainty was included for the exposure‐efficacy response model using bootstrap resampling (n = 100). Results are shown for (a) all individuals combined or (b) split for individuals with a low infection intensity (left panel) or moderate‐to‐high infection intensity (right panel). The solid line and black dots depict the probability of being cured for each dose level, where the grey area indicate the 95% confidence interval. The horizontal dashed line shows the 0.9 (90%) level. Raw data for this figure is shown in Table S5
