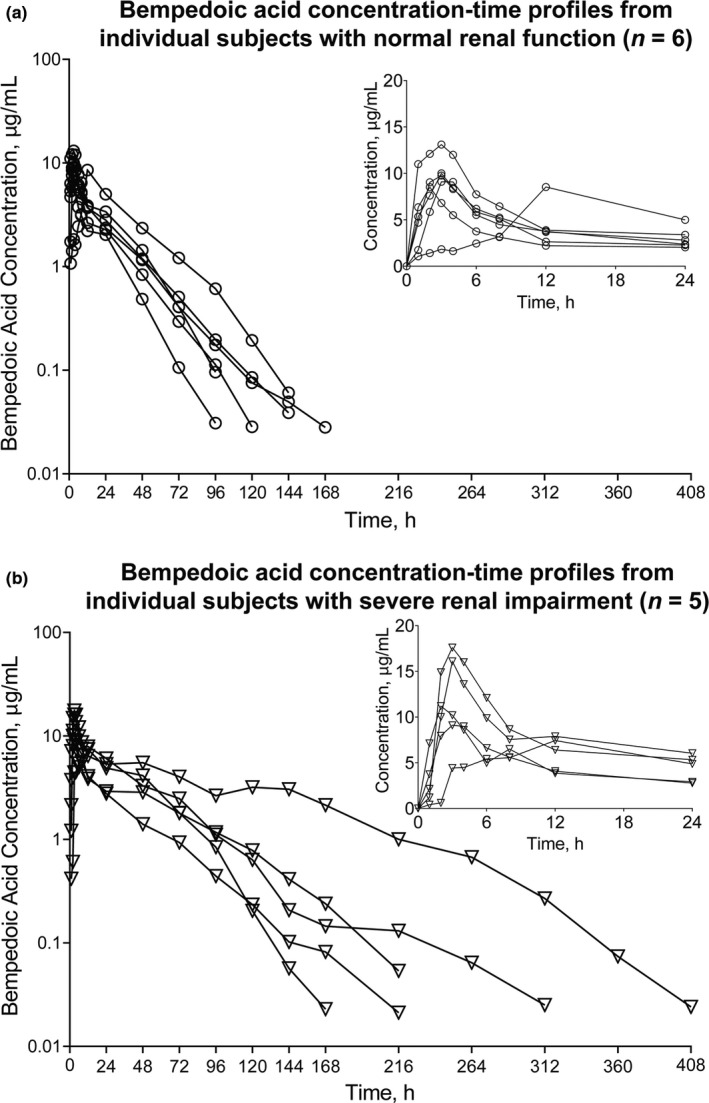
FIGURE 3.

Bempedoic acid plasma concentration‐time profiles from individual subjects with (a) normal renal function (n = 6) and (b) severe renal impairment (n = 5) after single bempedoic acid 180‐mg dose administration. Insert depicts linear profiles of subjects with (a) normal renal function and (b) severe renal impairment on a 0–24 h time scale
