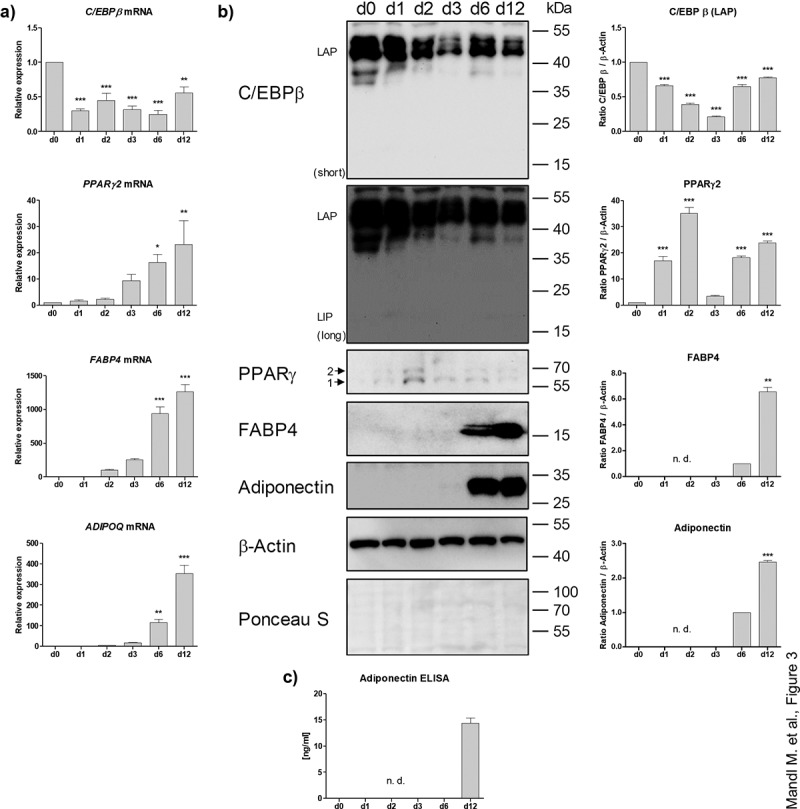
Figure 3.

Analysis of adipogenic markers in the course of differentiation. (a) mRNA expression of adipogenic genes measured by RT-qPCR. A representative result of n = 3 different donors is shown. Values are presented as mean ±SEM of three technical replicates. Statistical analysis was done using one-way ANOVA with Dunnett's Multiple Comparison Test. (b) Western blot analysis of adipogenic markers corresponding to (a). Left panel: A representative result of n = 3 different donors is shown. β-Actin served as loading control. Right panel: Densitometric analysis. Values are presented as mean ± SEM of three measurements. Statistical analysis was done using one-way ANOVA with Dunnett's Multiple Comparison Test. (c) Adiponectin ELISA of cell culture supernatants corresponding to (a) and (b). n. d.: not determined.
