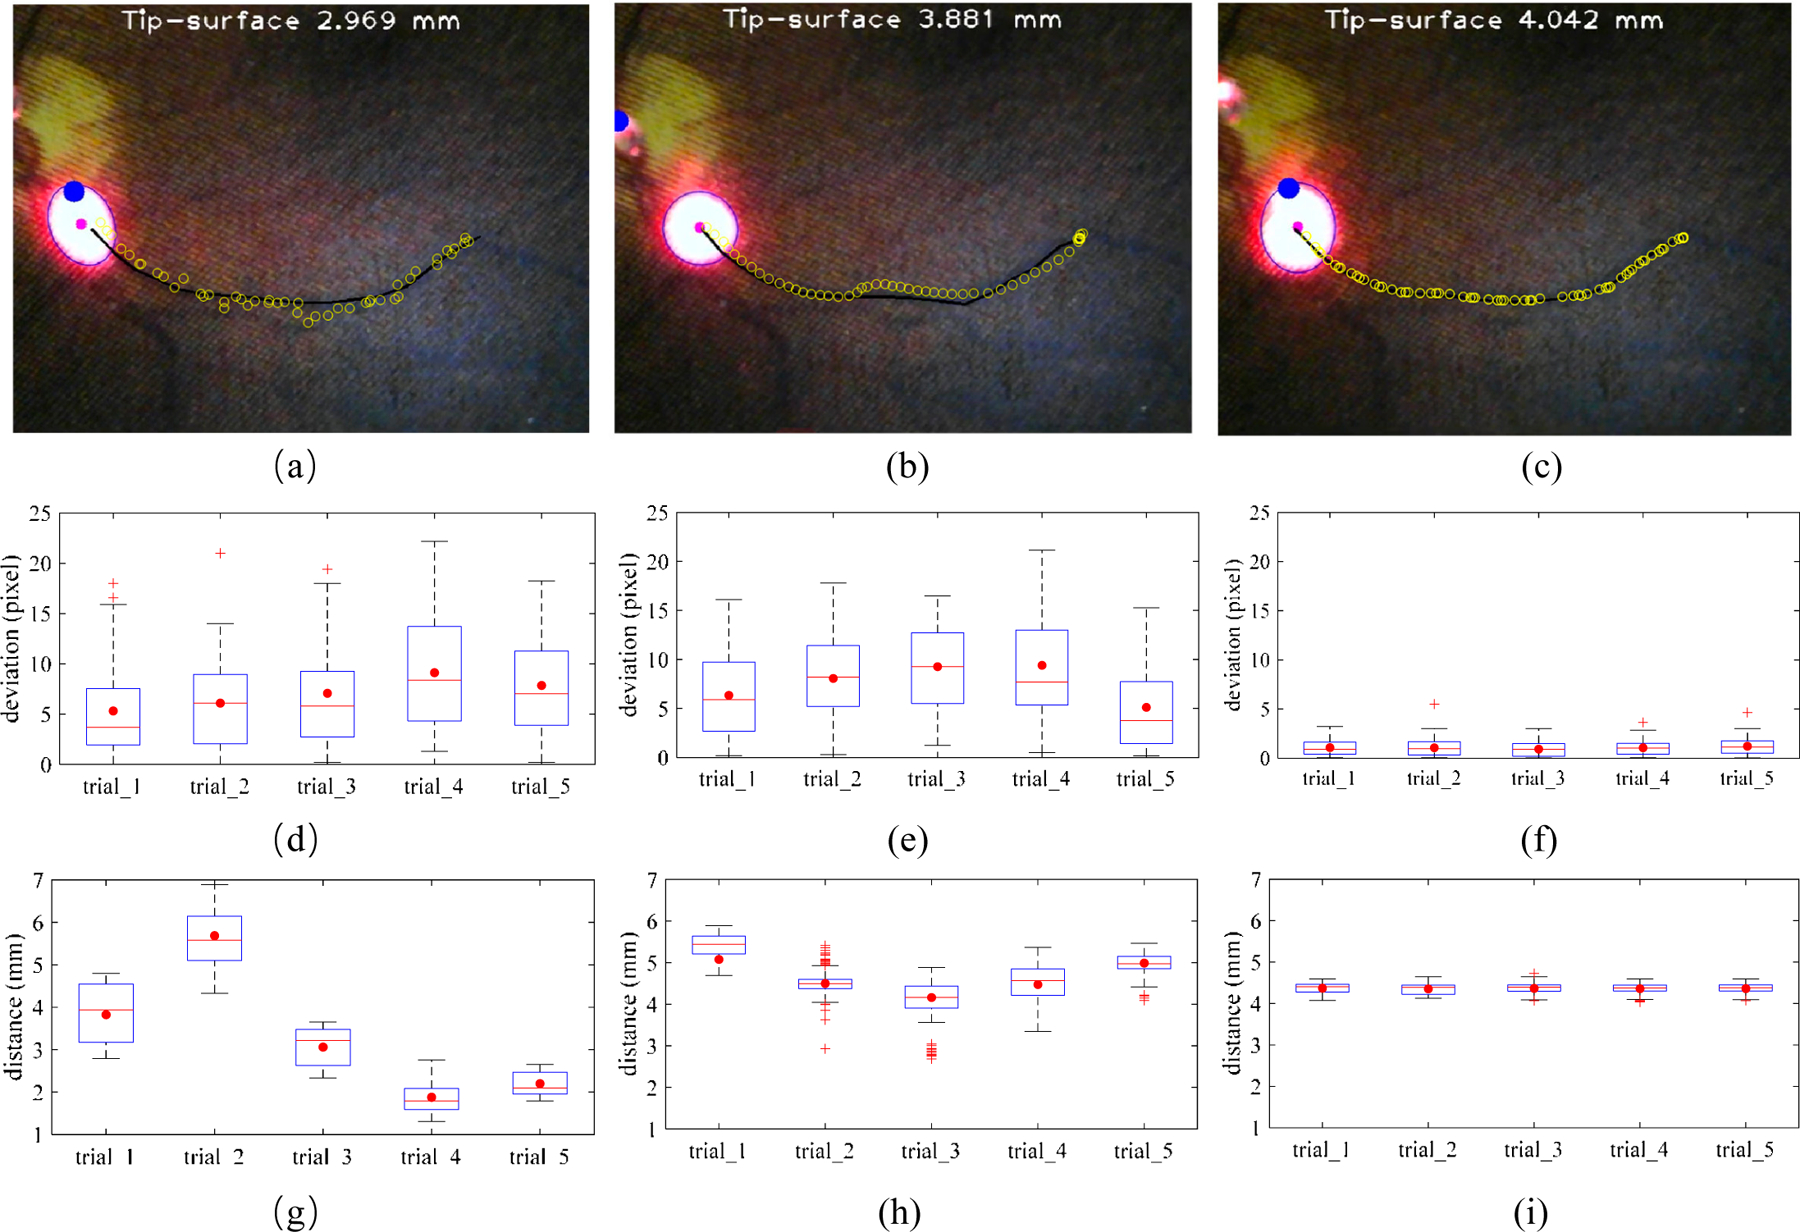
Fig. 10.

The comparison of three vessel tracking methods on the eye phantom. The manual tracking (a), cooperative control tracking with SHER (b), and spotlight-based automatic tracking with SHER (c). The black line is the vessel line for tracking. The blue circles are the spotlight center trajectories for each tracking trail. The tracking deviation between the target vessel and spotlight center trajectory with 5 times of the manual tracking (c), cooperative control tracking with SHER (d), and spotlight-based automatic tracking with SHER (e). The tip-to-surface distance calculated by the spotlight pattern for 5 times of the manual tracking (f), cooperative control tracking with SHER (g), and spotlight-based automatic tracking with SHER (i). The whiskers show the minimum and maximum recorded change of the recorded value while the first and third quartiles show the start and the end of the box. Band, red dot, and cross represent median, mean, and outliers of the recorded changes, respectively.
