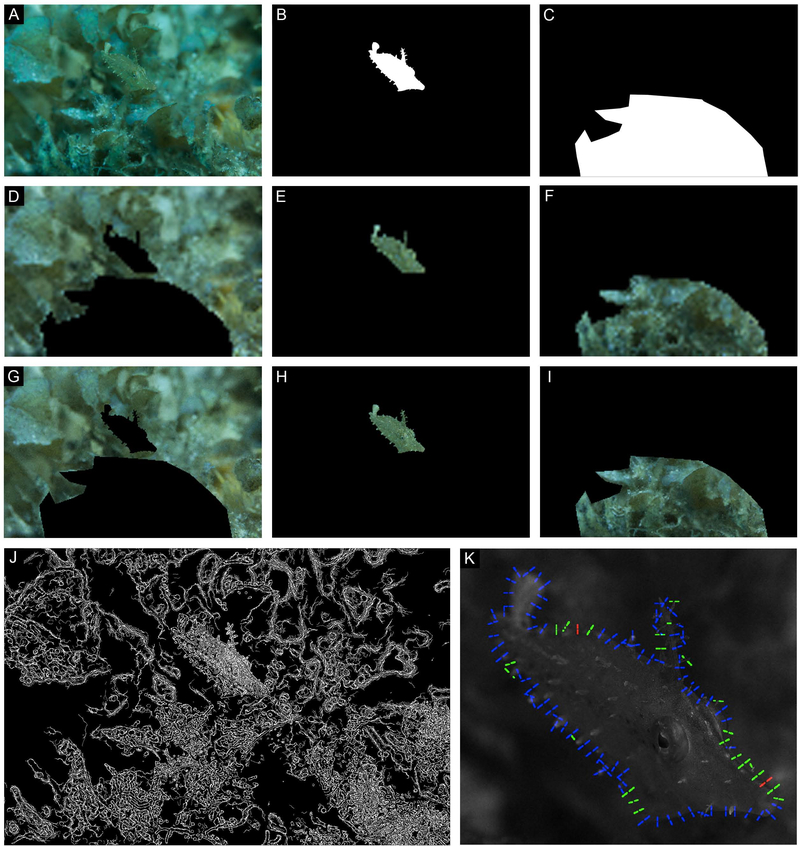
Figure 6:
A) Filefish camouflaged in situ; animal was en route from one coral to another. (B-C) Masks created to isolate the animal (B) from its stimulus and background (C). (D-F) Low resolution (pupil is 1 pixel) images of background (D), animal (E), and stimulus (F) analyzed for color match. (G-I) Higher resolution (pupil is 4 pixels) images of background (G), animal (H), and stimulus (I) analyzed for color match. (J) Results of the Canny edge detection analysis. (K) Results of the local contrast analysis; regions where contrast is similar (<10% different) are color coded green, regions where the animal is darker than background is red, and regions where the animal is lighter than the background are blue.

