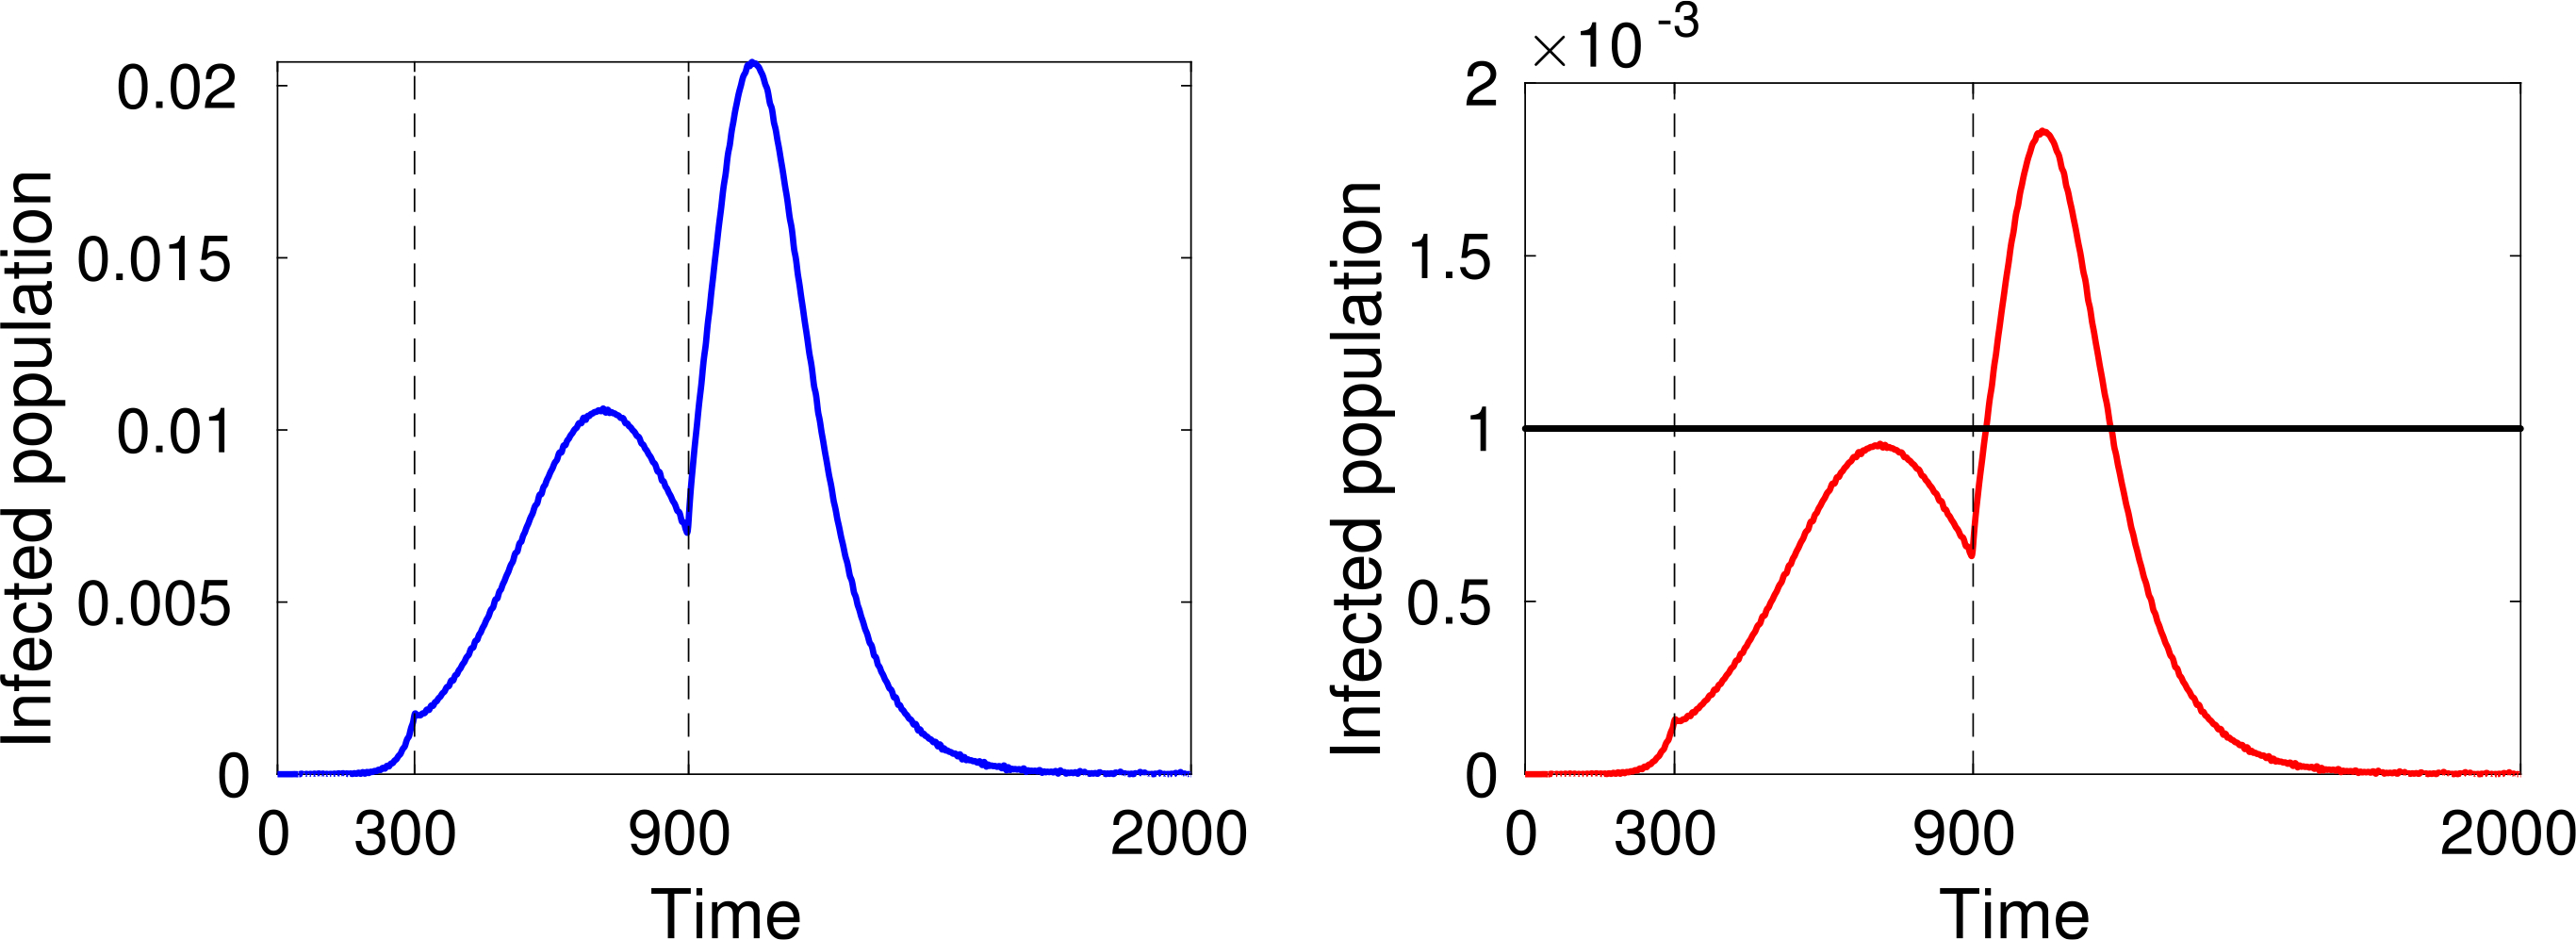
Fig. 9. α.

α = 0.4 for t < 300, then reduced to α = 0.25 at t = 300, and set back to the “normal/initial” state at t = 900. Left: Total number of active cases. Right: Estimated number of patients requiring ICU admission in relation to system capacity.
