. 2022 Mar 18;11:e65310. doi: 10.7554/eLife.65310

Figure 1. Analysis workflow.

The figure summarizes the analyses conducted in this study. The first step was (1) the identification of blood autosomal cis eQTMs (1 Mb window centered at the transcription start site, TSS, of the gene) in 823 European ancestry children from the HELIX project, by linear regression models adjusted for age, sex, cohort, and blood cell type proportions. All the associations are reported in the web catalogue (http://www.helixomics.isglobal.org/) and in Dryad (doi:10.5061/dryad.fxpnvx0t0). Then, (2) we explored the distance from the eCpG (CpG involved in an eQTM) to eGene’s TSS (gene involved in an eQTM), the effect size of the association, and classified eCpGs in different types. Next, (3) we evaluated the proportion of eGenes potentially inferred through annotation of eCpGs to the closest gene. Finally, (4) we functionally characterized eCpGs and eGenes; (5) assessed the contribution of genetic variants; and (6) evaluated the influence of age.

Figure 1.

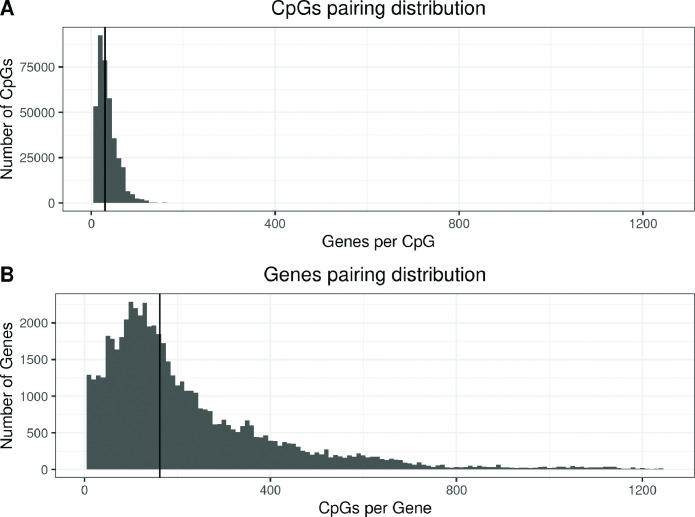
Figure 1—figure supplement 1. Distribution of enes and CpGs in all CpG-Gene pairs.

Figure 1—figure supplement 1.

(A) Distribution of the number of enes paired with each CpG. The y-axis represents the number of CpGs that are paired with a given number of enes, indicated in the x-axis. The vertical line marks the median of the distribution. Each CpG was paired to a median of 30 Genes (IQR: 20; 46). (B) Distribution of the number of CpGs paired with each ene. The y-axis represents the number of enes that are paired with a given number of CpGs, indicated in the x-axis. The vertical line marks the median of the distribution. Each ene was paired to a median of 162 CpGs (IQR: 93; 297).

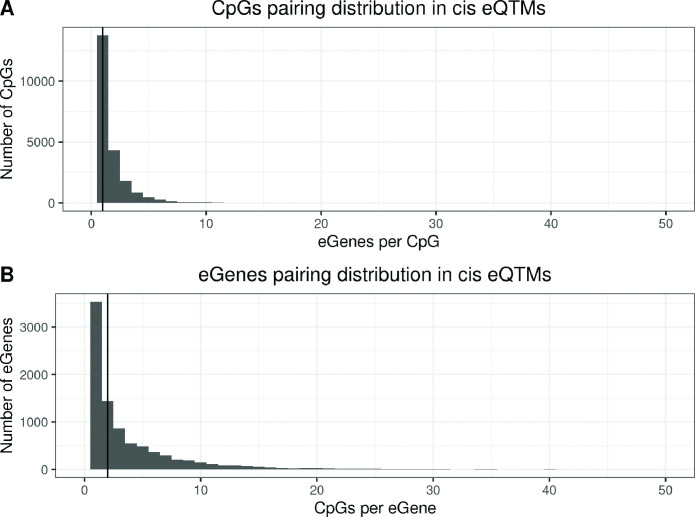
Figure 1—figure supplement 2. Distribution of eGenes and eCpGs in autosomal cis eQTMs.

Figure 1—figure supplement 2.

(A) Distribution of the number of eGenes paired with each eCpG in eQTMs. The y-axis represents the number of eCpGs that are paired with a given number of eGenes, indicated in the x-axis. Each eCpG was associated with a median of 1 eGene (IQR = 1; 2). (B) Distribution of the number of eCpGs paired with each eGenes in eQTMs. The y-axis represents the number of eGenes that are paired with a given number of eCpGs, indicated in the x-axis. Each eGene was associated with a median of 2 eCpGs (IQR = 1; 5).

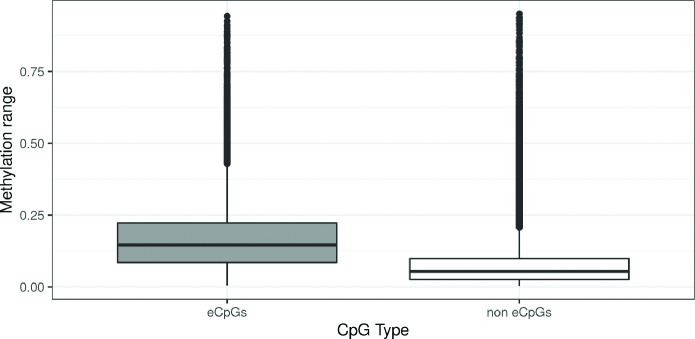
Figure 1—figure supplement 3. DNA methylation range by CpG type.

Figure 1—figure supplement 3.

CpGs were classified in: eCpGs (CpGs associated with gene expression, N = 21,966, in grey) and non eCpGs (N = 364,452, in white). Methylation range was computed as the difference between the methylation values in percentile 1 and percentile 99 (Lin et al., 2017).

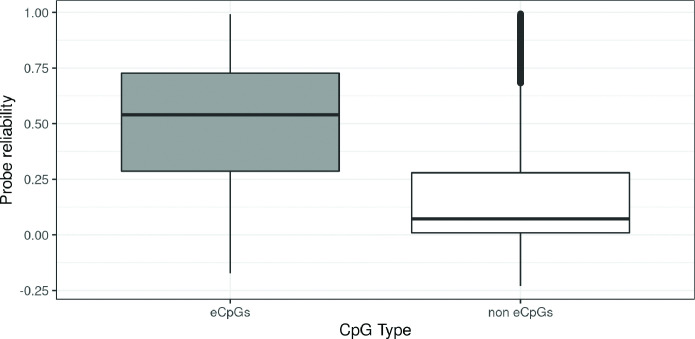
Figure 1—figure supplement 4. Probe reliability by CpG type.

Figure 1—figure supplement 4.

CpGs were classified in: eCpGs (CpGs associated with gene expression, N = 21,966, in grey) and non eCpGs (N = 364,452, in white). Probe reliability was based on intraclass correlation coefficients (ICC) obtained from Sugden et al., 2020.

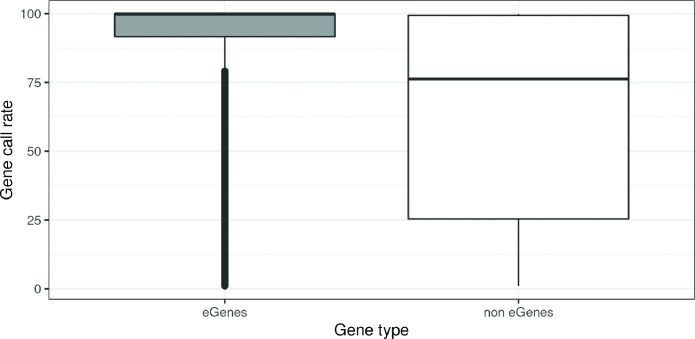
Figure 1—figure supplement 5. Genes call rate distribution by Gene type.

Figure 1—figure supplement 5.

Genes were classified in: eGenes (Genes associated DNA methylation, N = 8,886, in grey) and non eGenes (N = 51,806, in white). For a given Gene, call rate is the proportion of children with gene expression levels over the background noise.