. 2022 Mar 18;11:e65310. doi: 10.7554/eLife.65310

Figure 4. Genetic contribution to autosomal cis eQTMs in children’s blood.

CpGs were grouped by the number of Genes they were associated with, where 0 means that a CpG was not associated with any Gene (non eCpG). (A) Total additive heritability and (B) SNP heritability as inferred by Van Dongen and colleagues (van Dongen et al., 2016). The y-axis represents heritability and the x-axis each group of CpGs associated with a given number of Genes. (C) Proportion of CpGs having a meQTL (methylation quantitative trait locus), by each group of CpGs associated with a given number of Genes.

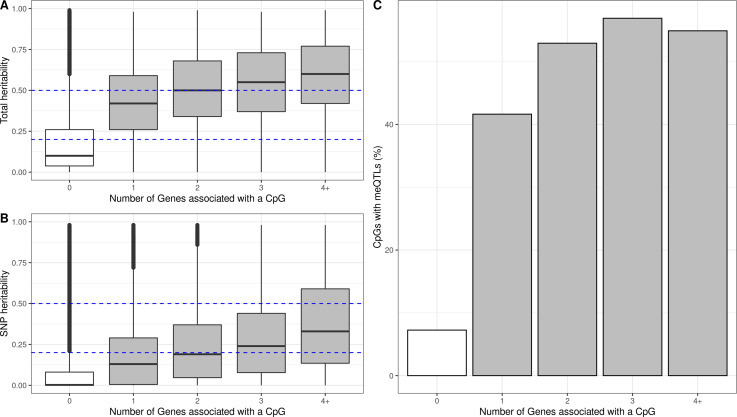
Figure 4.

Figure 4—figure supplement 1. Heritability of methylation levels in CpGs with reliable measurements.

Figure 4—figure supplement 1.

Only CpGs measured with reliable probes (ICC >0.4) were considered (Sugden et al., 2020). CpGs were grouped by the number of Genes they were associated with, where 0 means that a CpG was not associated with any Gene (non eCpGs, in white). (A) Total additive heritability as inferred by Van Dongen and colleagues (van Dongen et al., 2016), by each group of CpGs associated with a given number of Genes. (B) SNP heritability as inferred by Van Dongen and colleagues (van Dongen et al., 2016), by each group of CpGs associated with a given number of Genes.
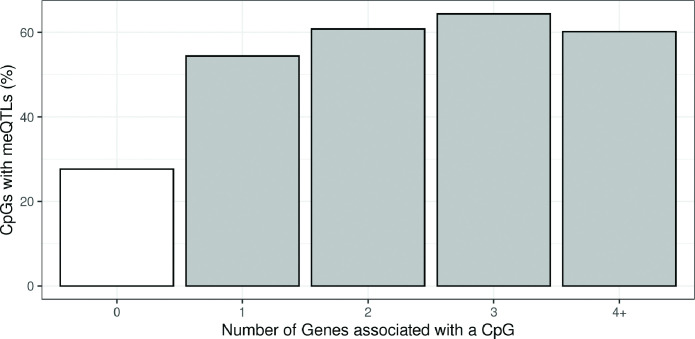
Figure 4—figure supplement 2. Proportion of CpGs having a meQTL (methylation quantitative trait loci) among CpGs with reliable measurements.

Figure 4—figure supplement 2.

Only CpGs measured with reliable probes (ICC > 0.4) were considered (Sugden et al., 2020). CpGs were grouped by the number of Genes they were associated with.
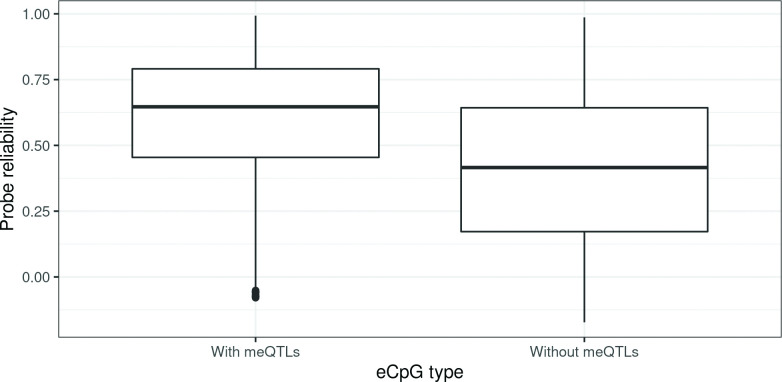
Figure 4—figure supplement 3. Probe reliability in autosomal cis eCpGs according to association with genetic variants.

Figure 4—figure supplement 3.

eCpGs were classified in two groups, depending on whether their methylation values were associated with any genetic variant. Probe reliabilities were based on intraclass correlations (ICCs) obtained from Sugden et al., 2020.
Figure 4—figure supplement 4. Example of a trio of SNP-CpG-Gene.

Figure 4—figure supplement 4.

(A) Methylation levels (cg15580684) by SNP genotypes (rs11585123). (B) Gene expression levels (TC01000080.hg.1, AJAP1 gene) by SNP genotypes (rs11585123). (C) Correlation between gene expression (TC01000080.hg.1, AJAP1 gene) and methylation levels (cg15580684).