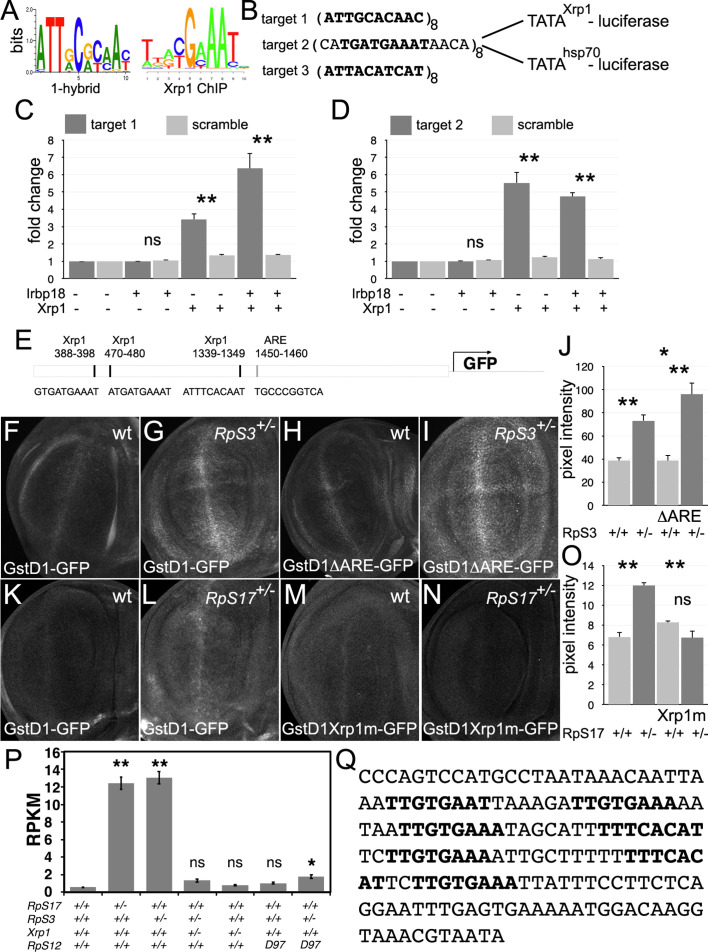
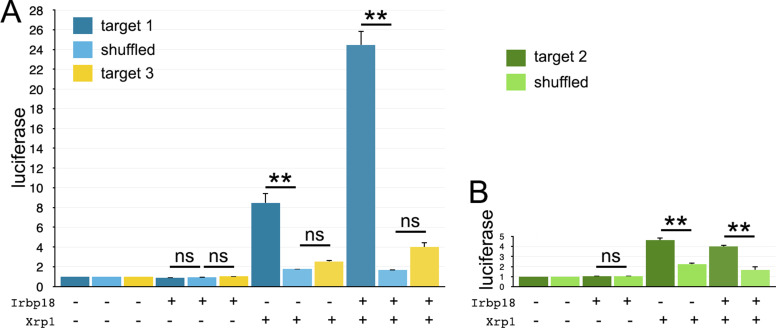
Figure 10. Transcriptional regulation by Xrp1.
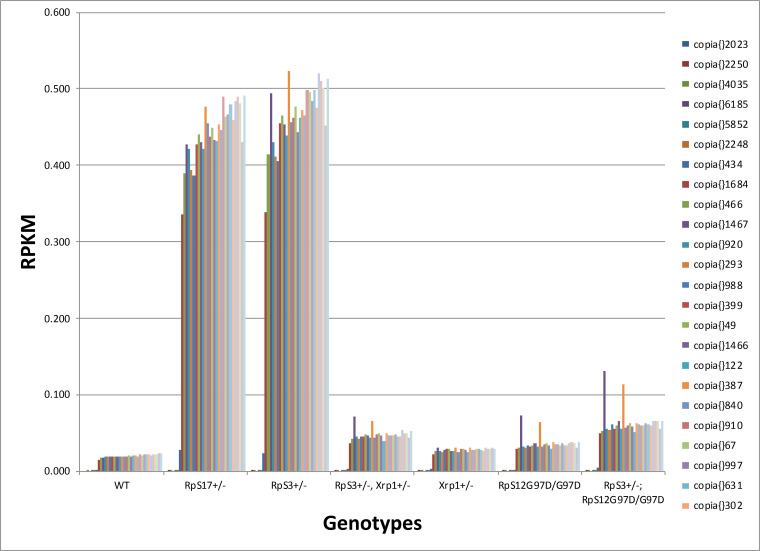
(A) Xrp1/Irbp18 binding consensus defined by bacterial 1-hybrid studies (Zhu et al., 2011) and by Xrp1 ChIP from Drosophila eye imaginal discs overexpressing an Xrp1-HA protein (Baillon et al., 2018). (B) Xrp1 binding motif sequences multimerized in luciferase reporter plasmids upstream of transcription start sites from the Xrp1 gene or from the hsp70 gene. Targets 1 and 3 were based on the 1-hybrid consensus, target 2 is the P element sequence footprinted by Xrp1-Irbp18 (Francis et al., 2016). The match to the consensus sites is shown in bold type. (C) Luciferase assays following transfection of reporters and protein expression plasmids into S2 cells. The target 1-TATAXrp1 reporter showed sequence-specific activation by transfected Xrp1. Transfected Irbp18 alone had no effect, but synergized with Xrp1. p-Values for comparisons between target one reporters and scrambled reporters were: Padj = 1, Padj = 0.00827, Padj = 3.47 × 10⁻⁷, respectively. (D) Luciferase assays following transfection of reporters and protein expression plasmids into S2 cells. The target 2-TATAXrp1 reporter showed sequence-specific activation by transfected Xrp1. Transfected Irbp18 alone had no effect. p-Values for comparisons between target two reporters and scrambled reporters were: Padj = 1, Padj = 2.00 × 10⁻⁸, Padj = 1.96 × 10⁻⁷ respectively. (E) Potential regulatory sequences in the 2.7 kb upstream intergenic fragment used in the GstD1-GFP reporter (Sykiotis and Bohmann, 2008; Brown et al., 2021).3 Xrp1-binding motifs and the antioxidant response element (ARE) are indicated. (F–I) and (K-N) show projections from the central disc-proper regions of wing discs expressing reporter transgenes in the indicated genetic backgrounds. (F) Baseline GstD1-GFP expression in the wild-type wing disc. (G) Elevated GstD1-GFP expression in the RpS3+/- wing disc. (H) Baseline GstD1ΔARE-GFP expression in the wild-type wing disc. (I) Elevated GstD1ΔARE-GFP expression in the RpS3+/- wing disc. (J) Quantification of these results. Average pixel intensity from wing pouch regions was measured. Mean± SEM from multiple samples is shown. N = 5 for each genotype. Exact p values were: for GstD1-GFP in RpS3+/- compared to RpS3+/+, Padj = 0.00257; for GstD1ΔARE-GFP in RpS3+/- compared to RpS3+/+, Padj = 2.55 × 10⁻⁵; for GstD1-GFP in RpS3+/+ compared to GstD1ΔARE-GFP in RpS3+/+, Padj = 0.993; for GstD1-GFP in RpS3+/- compared to GstD1ΔARE-GFP in RpS3+/-, Padj = 0.0313. (K) baseline GstD1-GFP expression in the wild type wing disc. (L) Elevated GstD1-GFP expression in the RpS17+/- wing disc. (M) baseline expression of GstD1-GFP with all 3 Xrp1-binding motifs mutated in the wild type wing disc. (N) Expression of GstD1-GFP with all 3 Xrp1-binding motifs mutated was similar in the RpS17+/- wing disc to the wild type control. (O) Quantification of these results. Average pixel intensity from wing pouch regions was measured. Mean± SEM from multiple samples is shown. N = 5,6,5,6 for respective samples. Exact p values were: for GstD1-GFP in RpS3+/- compared to RpS3+/+, Padj = 2.34 × 10⁻⁶; for GstD1mXrp1-GFP in RpS3+/- compared to RpS3+/+, Padj = 0.116; for GstD1-GFP in RpS3+/+ compared to GstD1mXrp1-GFP in RpS3+/+, Padj = 0.112; for GstD1-GFP in RpS3+/- compared to GstD1mXrp1-GFP in RpS3+/-, Padj = 1.19 × 10⁻⁶. (P) Pooled copia transcript levels for indicated genotypes determined from mRNA-seq data. Mean± standard deviation is shown. Values for individual copia insertions are shown in Figure 10—figure supplement 2. Asterisks indicate statistical significance of the difference from the wild type control: **, p < 0.01; *, p < 0.05; ns, p ≥ 0.05. Exact p values were: for RpS17+/- compared to wild type, p = 4 × 10–14; for RpS3+/- compared to wild type, p = 2.33 × 10⁻¹⁴; for RpS3+/- Xrp1+/- compared to wild type, p = 0.262; for RpS3+/- Xrp1+/- compared to wild type, p = 0.262;for Xrp1+/- compared to wild type, p = 0.494; for RpS3+/- Xrp1+/- compared to wild type, p = 0.262; for rpS12D97/D97 compared to wild type, p = 0.858; for RpS3+/- rpS12D97/D97 compared to wild type, p = 0.0201; for RpS3+/- rpS12D97/D97 compared to wild type, p = 0.0201; for RpS3+/- Xrp1+/- compared to RpS3+/-, p = 4.91 × 10⁻¹⁴; for RpS3+/- Xrp1+/- compared to Xrp1+/-, p = 0.635; for RpS3+/- rpS12D97/D97 compared to rpS12D97/D97, p = 0.251. Statistics:1-way ANOVA with Bonferroni-Holm correction for multiple testing was performed for the data shown in panels C,D,J,O,P. Data in panels C,D were based on triplicate measurements from each of three biological replicates for each transfection. Data in panel P were based on three biological replicates for each genotype. Genotypes: F: GstD1-GFP/+, G: GstD1-GFP/+; FRT82 RpS3 p{arm:LacZ}/+, H: GstD1ΔARE-GFP/+, I: GstD1ΔARE-GFP/+; FRT82 RpS3 p{arm:LacZ}/+, K: GstD1-GFP/+, L: GstD1-GFP; RpS17 p{arm:LacZ} FRT80B/+, M: GstD1 Xrp1m –GFP, N: GstD1Xrp1m-GFP; RpS17 p{arm:LacZ} FRT80B/+. Genotypes of P graph per column: 1st: w11-18; FRT82B/+, 2nd: w11-18; w p{hs:FLP}; RpS17 p{ubi:GFP} FRT80B/+,3rd: w11-18;w p{hs:FLP}; FRT82 RpS3 p{arm:LacZ/+, 4th: w11-18;w p{hs:FLP}; FRT82 RpS3 p{arm:LacZ/FRT82B FRT82B Xrp1M2–73, 5th: w11-18; FRT82B Xrp1M2–73 / +, 6th: w11-18; rpS12D97 FRT80B / rpS12D97 FRT80B, 7th: w11-18; rpS12D97 FRT80B / rpS12D97 FRT80B RpS3.


