
Figure 5. eIF2α phosphorylation can induce Xrp1 expression and cell competition.
All panels show single confocal planes from third instar wing imaginal discs, mosaic for the genotypes indicated. All the sections pass through the central region of the disc proper containing nuclei in all genotypes, as indicated by the DNA stain in blue in some panels. (A) Clones expressing white RNAi (green). Clones induced by 7 min heat shock. (B) Clones expressing PPP1R15 RNAi (green)were fewer and smaller than the control (compare panel A). Clones induced by 7 min heat shock. (C) Clones expressing PPP1R15 RNAi (white) contain phosphorylated eIF2α (see C’). (D) Clones induced by 25 ± 5 min heat shock, which results in larger clone areas (white). Labelled clones expressing PPP1R15 RNAi reduced translation rate (see D’). (E) Labelled clones expressing PPP1R15 RNAi (green) underwent competitive apoptosis at interfaces with wild type cells (activated caspase Dcp1 in magenta; see also E’). (F) Nub-Gal4 drives gene expression in the wing pouch, shown in green for RFP, with little expression of Xrp1-HA (magenta; see also F’). (G) PPP1R15 RNAi induces Xrp1-HA expression in the wing pouch (magenta; see also G’). (H) Clones co-expressing PPP1R15 RNAi and Xrp1 RNAi (green) lacked competitive apoptosis (activated caspase Dcp1 in magenta; see also H’). (I) Clones expressing PPP1R15 RNAi (green). Experiment performed in parallel to panel H. Note competitive apoptosis at interfaces with wild type cells (activated caspase Dcp1 in magenta; see also I’), and smaller clone size. Cell death at the basal surface of the same disc shown in Figure 5—figure supplement 1F. (J) Clones co-expressing PPP1R15 RNAi and Xrp1 RNAi (white) showed less eIF2α phosphorylation than for PPP1R15 RNAi alone (compare panel C). Sample prepared in parallel to panel C (in the same tube from fixation to staining). (K) Xrp1 knock-down restored normal translation rate to cell clones expressing PPP1R15 RNAi (green; see also K’). Sample prepared in parallel to panel D (in the same tube from fixation to staining). Additional data relevant to this Figure is shown in Figure 5—figure supplement 1. Genotypes: A: {hs:FLP}/+; act> CD2> Gal4, UAS-GFP / UAS – RNAiw, B: {hs:FLP}/+; act> CD2> Gal4, UAS-GFP / UAS – RNAiPPP1R15 (line: BL 33011) (samples were processed on the same day, not on the same tube), C: {hs:FLP}/+; UAS – RNAiPPP1R15 /TRE-dsRed; act> CD2> Gal4, UAS-GFP /+(line: v107545) (processed in parallel with 5 J), D: {hs:FLP}/+; act> CD2> Gal4, UAS-GFP / UAS – RNAiPPP1R15 (line: BL 33011), E: {hs:FLP}/+; UAS – RNAiPPP1R15 /+; act> CD2> Gal4, UAS-GFP /+ (line: v107545),F: nubGal4, UAS-RFP/+; Xrp1-HA/RNAiw, G: nubGal4, UAS-RFP/ UAS – RNAiPPP1R15; Xrp1-HA/+ (line: v107545), H, J, K: {hs:FLP}/+; UAS – RNAiPPP1R15 / UAS-RNAiXrp1; act> CD2> Gal4, UAS-GFP /+ (line: v107545) (5 H processed in parallel with 5I. Also, 5 K processed in parallel with Figure 5—figure supplement 1B) (line RNAiPPP1R15: v107545 and line RNAiXrp1: v107860), I: {hs:FLP}/+; UAS – RNAiPPP1R15 /TRE-dsRed; act> CD2> Gal4, UAS-GFP /+ (line RNAiPPP1R15: v107545).

Figure 5—figure supplement 1. eIF2α phosphorylation induces Xrp1 expression and cell competition.

Figure 5—figure supplement 2. eIF2α phosphorylation reduces bristle size.
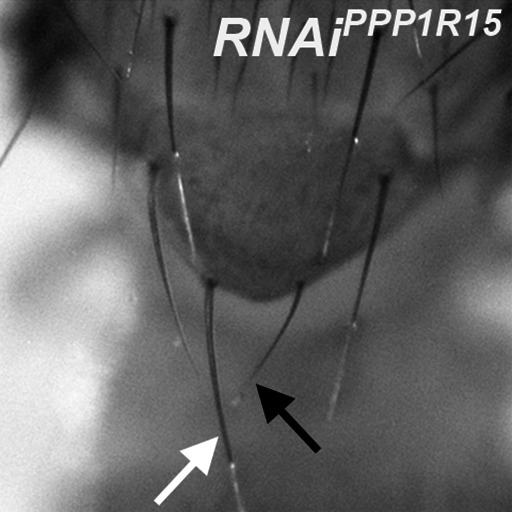
Figure 5—figure supplement 3. eIF2α phosphorylation is not required for cell competition.
