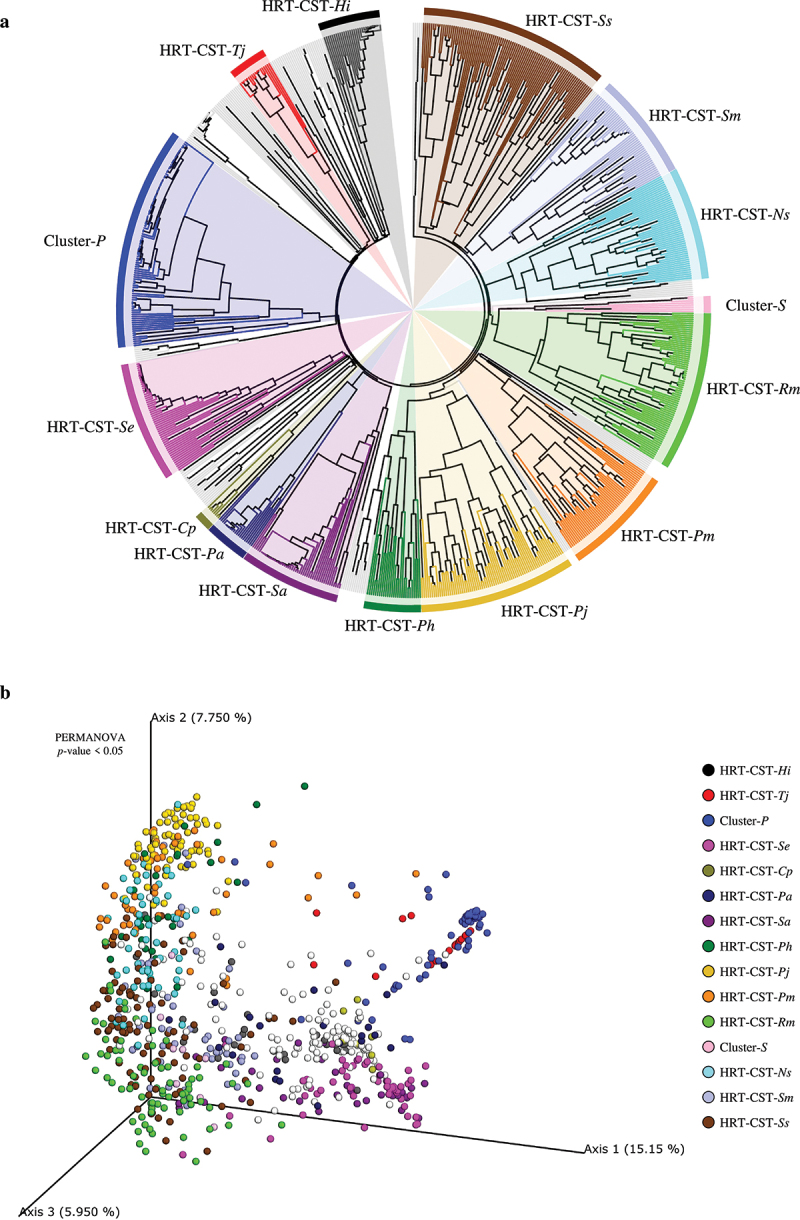
Figure 1.

Identification of HRT-CSTs. Panel a shows a circular cladogram of the HRT samples obtained by means of hierarchical clustering (HCL) analysis. The cladogram highlights the different CSTs identified by HCL analysis. Panel b reports the principal coordinate analysis (PCoA) of the HRT samples, subdivided by identified CSTs.
