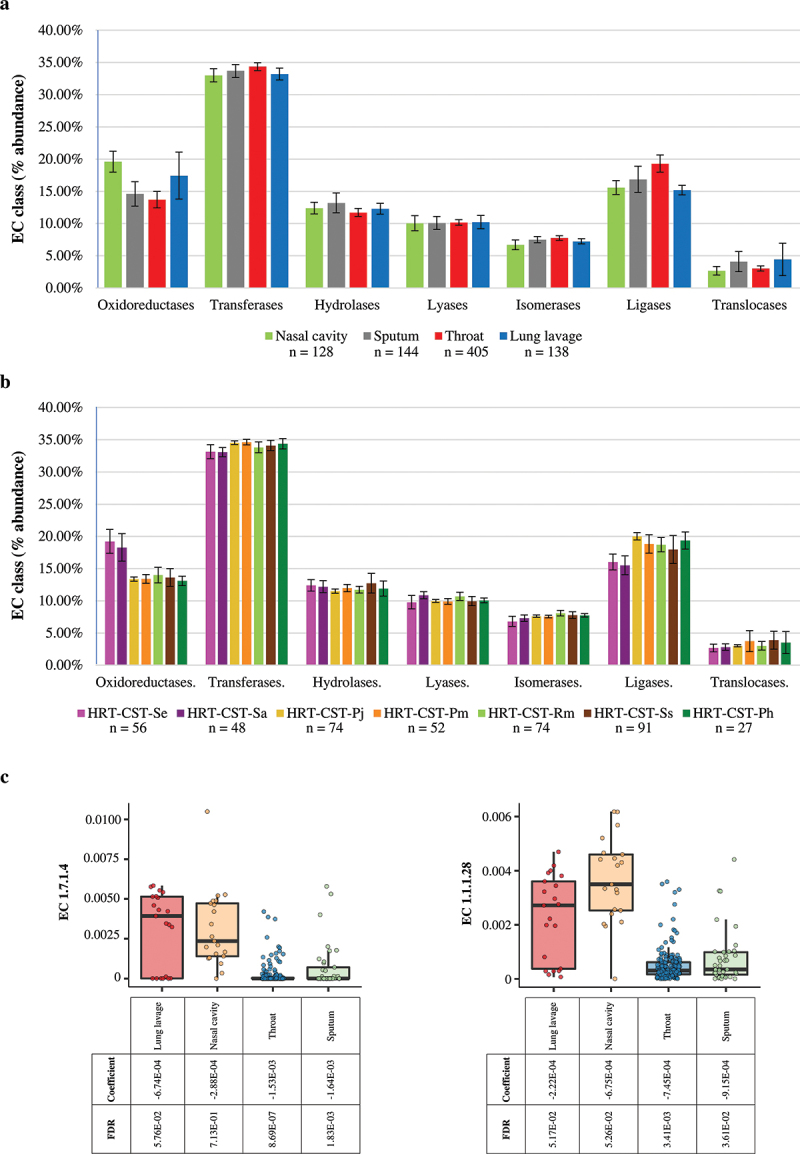
Figure 5.

Evaluation of metabolic pathways of HRT samples. Panel a reports on the bar plot representing the EC class abundance based on HRT compartments. The x‐axis represents the different HRT compartments, while the y‐axis indicates the relative abundance of each EC class. The whiskers reported the standard deviation. Panel b shows the bar plot indicating the EC class abundance based on HRT-CSTs. The x‐axis represents the different HRT compartments, while the y‐axis indicates the relative abundance of each EC class. The whiskers report the standard deviation. Panel c reports the multivariate analysis calculated on the two enzyme classes EC 1.7.1.4 and EC 1.1.1.28 through MaAslin2 software and represented with bar plot. The MaAsLin2 model are fitted with the enzyme classes, as well as HRT-CSTs, sampling methods as well as bioproject, and geographical origin.
