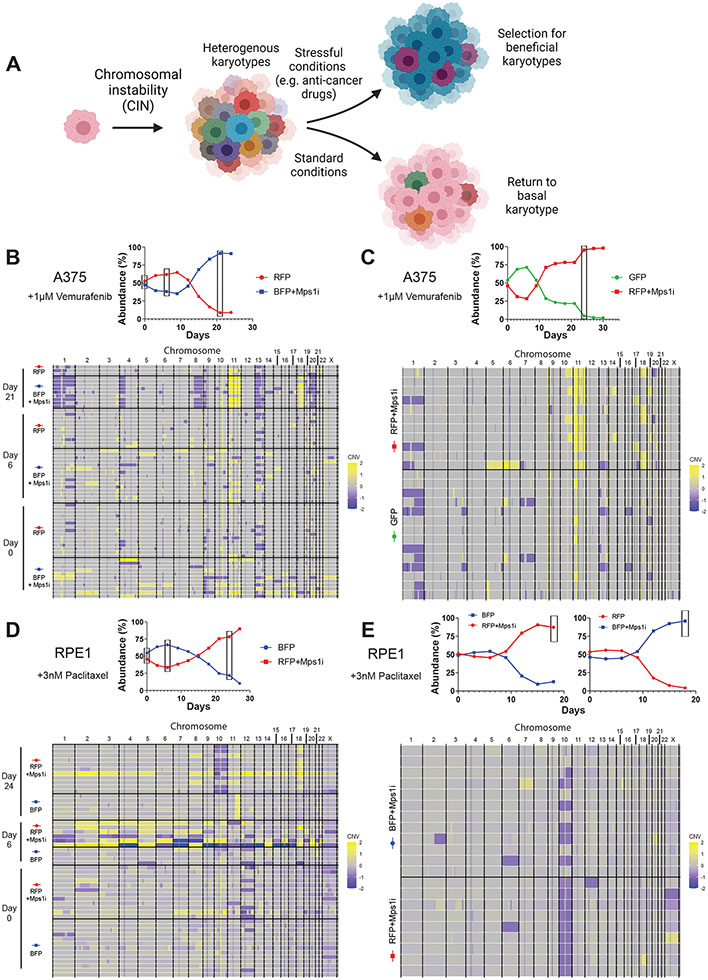
Figure 3. Cells that develop drug resistance following Mps1i exposure display recurrent aneuploidies.
(A) Diagram modeling selection for beneficial aneuploidies under stressful conditions.
(B-C) (Top) Plot of A375 competition in vemurafenib from which cells were isolated for single cell sequencing. Boxes indicate time points when cells were isolated. (Bottom) Heatmap displaying the karyotypic alterations of single cells isolated from the above competitions. See also Figure S3B.
(D-E) (Top) Plot of RPE1 competition in paclitaxel from which cells were isolated for single cell sequencing. Boxes indicate time points when cells were isolated. (Bottom) Heatmap displaying the karyotypic alterations of single cells isolated from various time points of the above competition.
N.B. – Competition plots shown in (B), (C), and (E) were previously shown in Figures 1B, S2A, and S2G, respectively.

