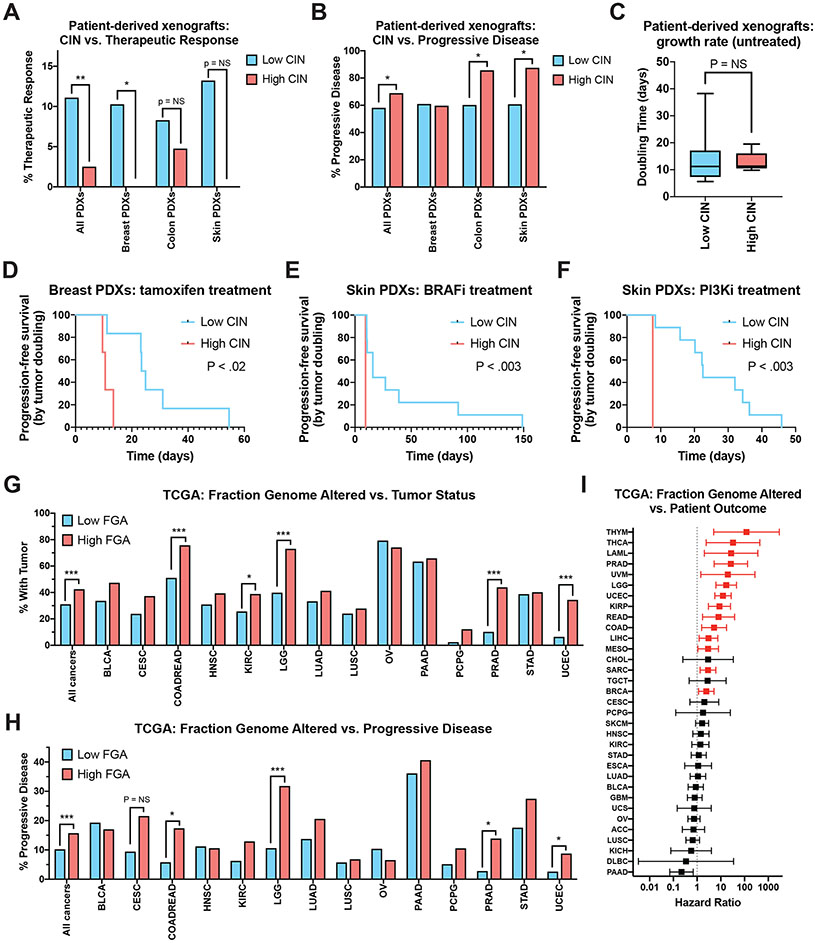
Figure 5. High levels of endogenous CIN are associated with poor drug responses in a set of patient-derived xenografts.
(A) The percent of PDXs that displayed a partial or complete therapeutic response to systemic therapy, sorted according to their degree of CIN.
(B) The percent of PDXs that displayed progressive disease in response to systemic therapy, sorted according to their degree of CIN.
(C) Box-plots showing the time required for an untreated PDX to double in volume, sorted according to their degree of CIN. Boxes indicate the 25th, 50th, and 75th percentiles, while the bars represent the 10th and 90th percentiles.
(D-F) Kaplan-Meier survival analysis of progression-free survival, defined as the time required for a treated PDX to double in volume, for (D) breast cancer PDXs treated with tamoxifen, (E) skin cancer PDXs treated with a BRAF inhibitor, (F) skin cancer PDXs treated with a PI3K inhibitor.
(G) The percent of patients from the TCGA who were classified as “not tumor free” at the end of the observation period, sorted according to their degree of FGA.
(H) The percent of patients from the TCGA who were classified as exhibiting disease progression following their frontline therapy, sorted according to their degree of FGA.
(I) A forest plot showing hazard ratios and 95% confidence intervals for Cox proportional hazards regression between FGA and patient outcome for each of the indicated cancer types. The hazard ratios plotted in red represent those that are significant at a P < .05 threshold.
Statistical comparisons in 5A, 5B, 5G, and 5H were performed using Fisher’s exact test. Statistical comparisons in 5C were performed using a two-sided t-test. Statistical comparisons between survival curves in 5D, 5E, and 5F were performed using a log-rank test. *, p < .05; **, p < .005; ***, p < .0005.

