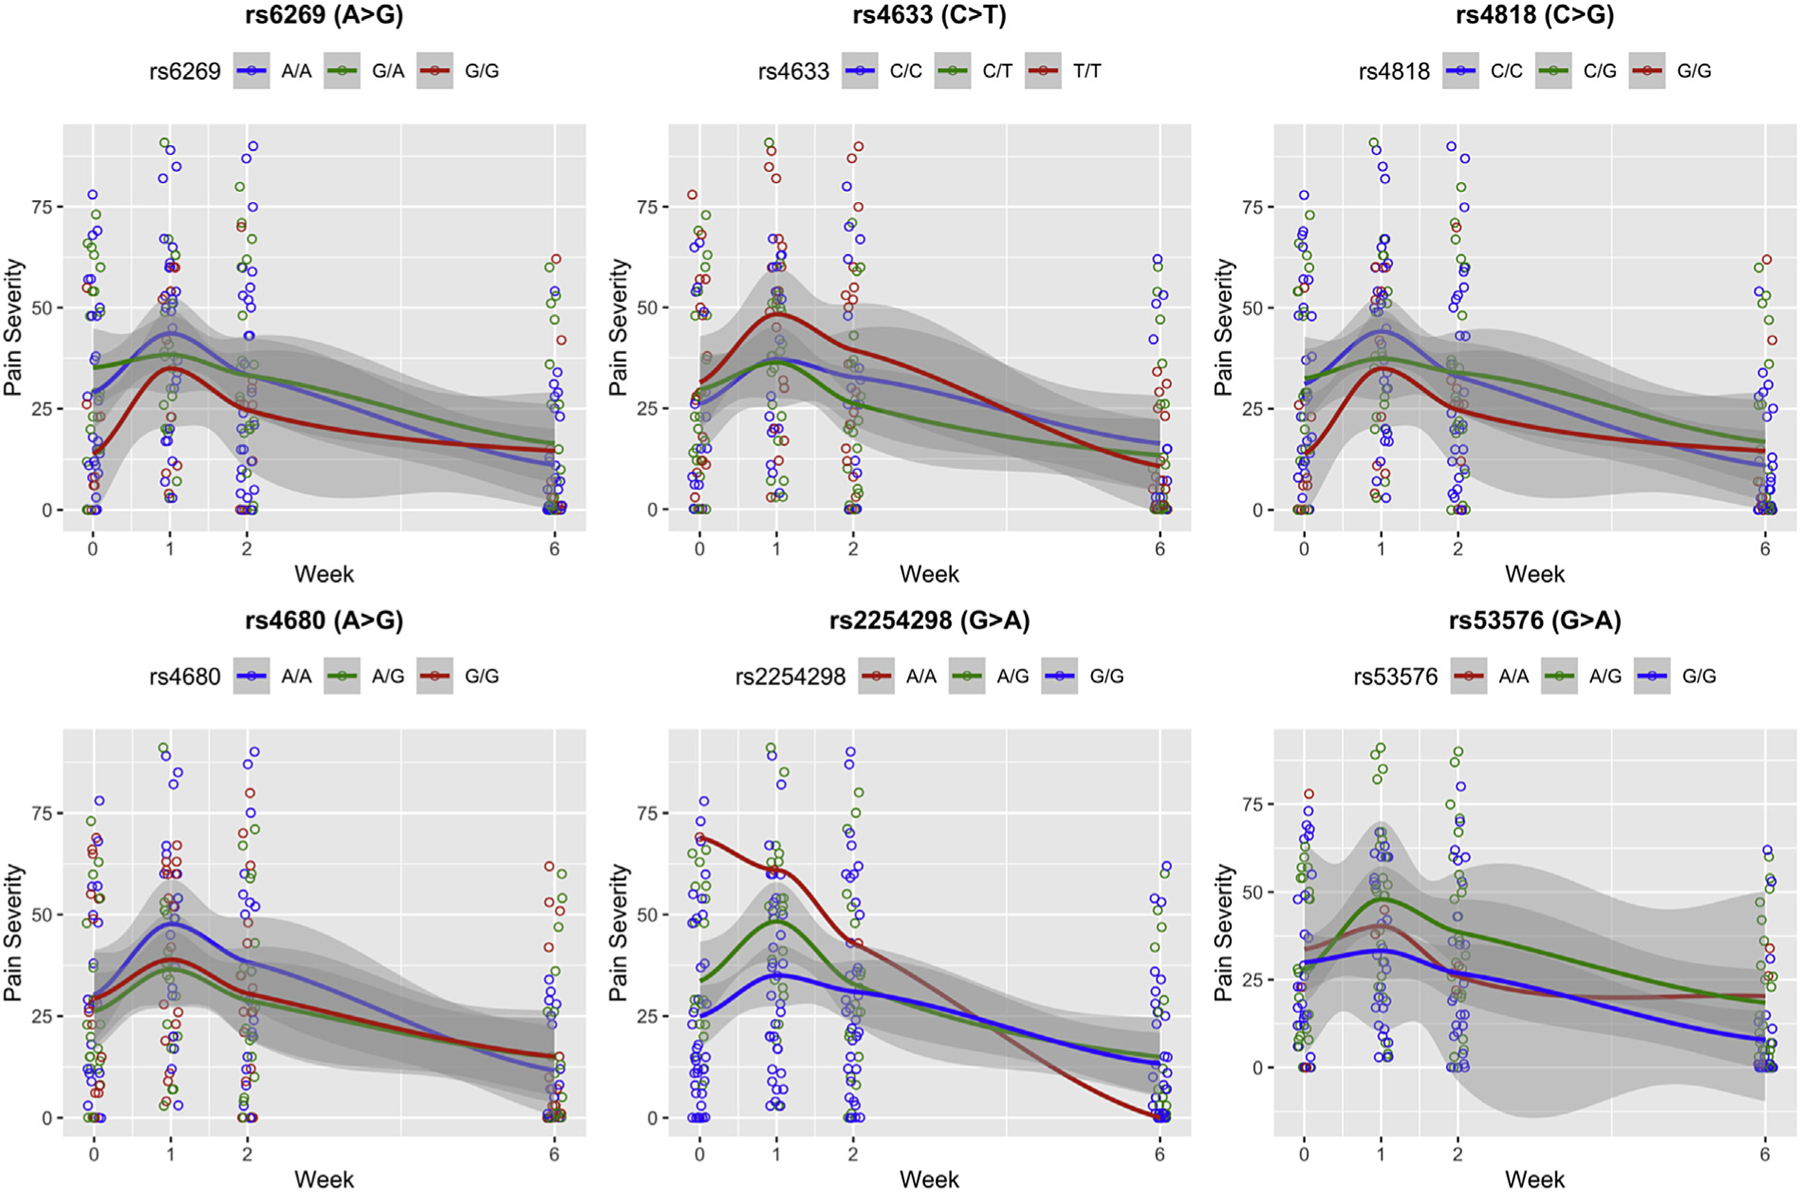
Figure 1.

The red curve in each plot represents the trend of mean pain severity for the homozygous minor (rs6269, rs4818, rs4680, GG; rs4633, TT; rs2254298, rs53576, AA); the green curve represents the heterozygous minor alleles (rs6269, G/A; rs4818 C/G; rs4680 A/G; rs4633, C/T; rs2254298, rs53576, A/G); the blue curve represents the homozygous major alleles (rs6269, rs4680, A/A; rs4818, rs4633, C/C; rs2254298, rs53576, A/A). The grey shade represents the confidence interval of the trend. Note that there was only one A/A of rs2254298 in the sample, so the red curve in the rs2254298 graph represents the pain severity trend for that single individual.
