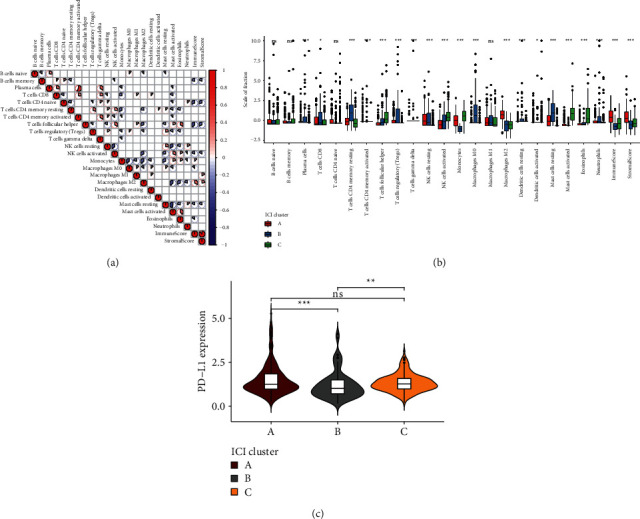
Figure 2.

The landscape of tumor microenvironment components in the three ICI subtypes of LGG. (a) Correlations between tumor-infiltrating immune cells, immune scores, and stromal scores in LGG tissues. The more towards red, the greater the positive correlation coefficient; the more towards blue, the greater the negative correlation coefficient. (b) Box plots for the infiltration levels of tumor-infiltrating immune cells in each ICI subtype. (c) Violin plots for the expression of PD-L1 in each ICI subtype. Kruskal-Wallis test, ns: not significant; ∗p < 0.05; ∗∗p < 0.01; ∗∗∗p < 0.001.
