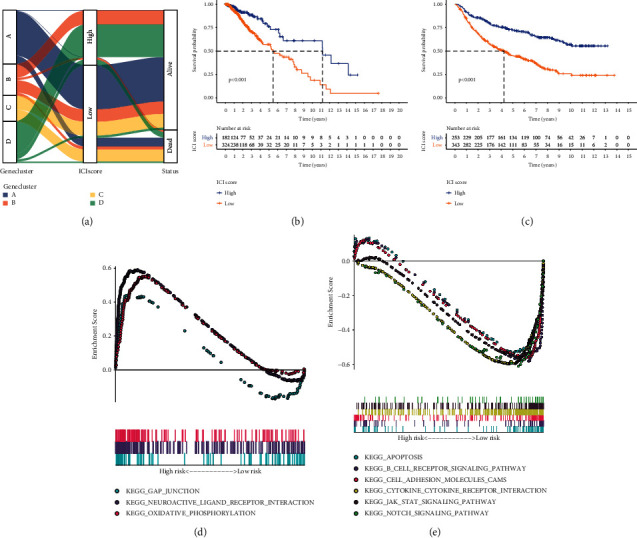
Figure 5.

Development of ICI score system for LGG. (a) Alluvial diagram for the distributions of ICI scores and survival status in the four ICI gene clusters. ((b) and (c)) Kaplan-Meier curves of OS for patients with high and low ICI scores in the (b) TCGA-LGG and (c) CGGA-LGG datasets. Log-rank test, p < 0.001. ((d) and (e)) GSEA for the enrichment results in (d) high and (e) low ICI score groups.
