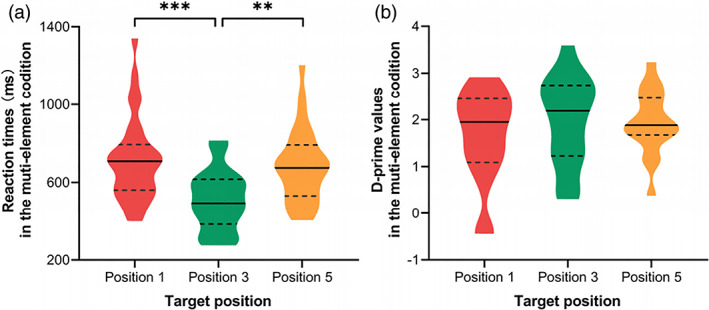
FIGURE 2.

Position‐based analyses on correct reaction times (a) and d’ values (b) of the visual 1‐back task with multiple elements while controlling the corresponding responses in single‐element condition. Error bars represent standardized deviations. ***, p < .001; **, p < .01
