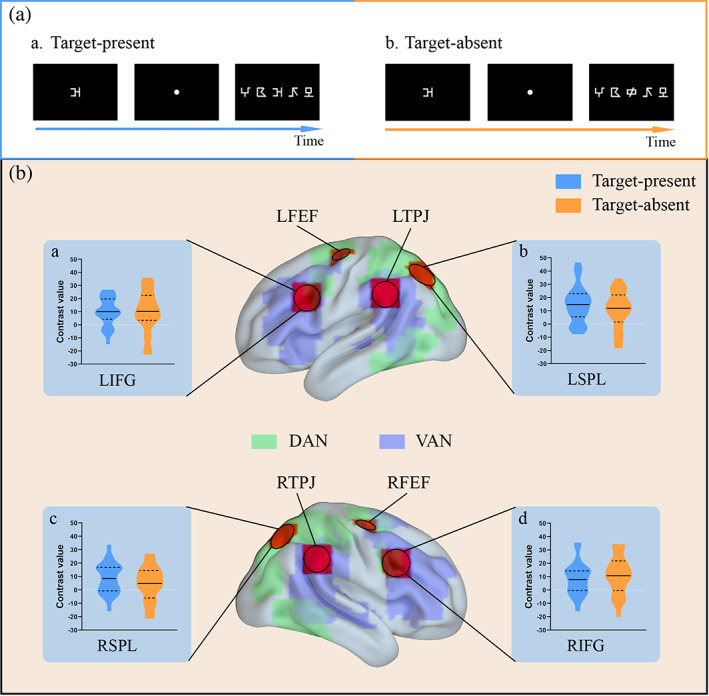
FIGURE 3.

Comparisons of brain activations between the two conditions of target presence in ROIs extracted by the coordinates from the study of Fox, Corbetta, Snyder, Vincent, and Raichle (2006). A, examples of a target‐present trial (a) and a target‐absent trial (b). B, selected ROIs in the confirmatory analysis and violin plots about the comparisons of relevant contrast values between the target‐present (blue violin plots) and target‐absent (orange violin plots) conditions. DAN, dorsal attention network, the green areas over the brain; VAN, ventral attention network, the purple areas over the brain. The base maps of dorsal and ventral attention networks were depicted by analyzing the synchronous acquisition of resting‐state fMRI data. L, left; R, right; FEF, frontal eye field; IFG, inferior frontal gyrus; SPL, superior parietal lobule; TPJ, temporoparietal junction
