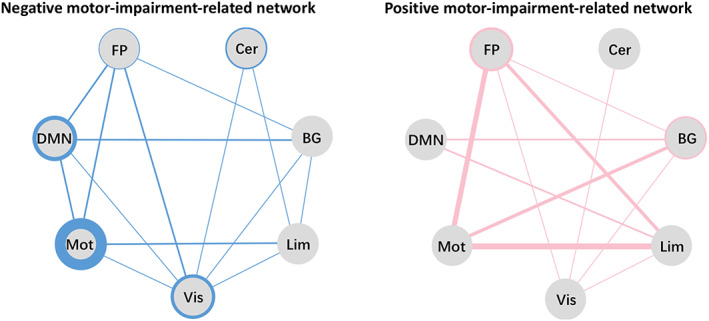
FIGURE 4.

Negative (left, blue) and positive motor‐impairment‐related networks (right, pink). To control for the possible effects of network size, the proportions of the within‐ and between‐network connections were obtained by dividing the actual number of connections by the total number of all possible connections. Each solid circle represents a functional network; thicker circles and lines represent a greater proportion of connectivity. BG, basal ganglia network; Cer, cerebellum network; DMN, default mode network; FP, frontoparietal network; Lim, limbic network; Mot, motor network; Vis, visual‐related network
