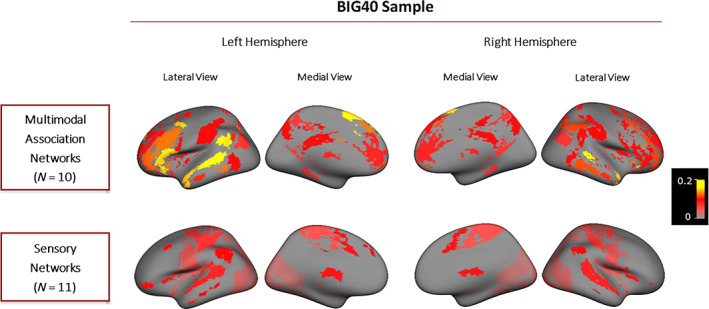
FIGURE 1.

SNP‐based heritability results obtained for multimodal association and sensory networks. Cortical surface maps displayed show the multimodal association and sensory networks measured in the BIG40 sample. Multimodal association networks are displayed at the top and the sensory networks at the bottom. Both the medial and lateral views of RSNs in the left and right hemispheres are displayed from left to right. RSNs are color‐coded according to their SNP‐based heritability—proportion of variance in the trait explained by SNP effects—whose scales are displayed on the right. RSN, resting state network; SNP, single nucleotide polymorphism
