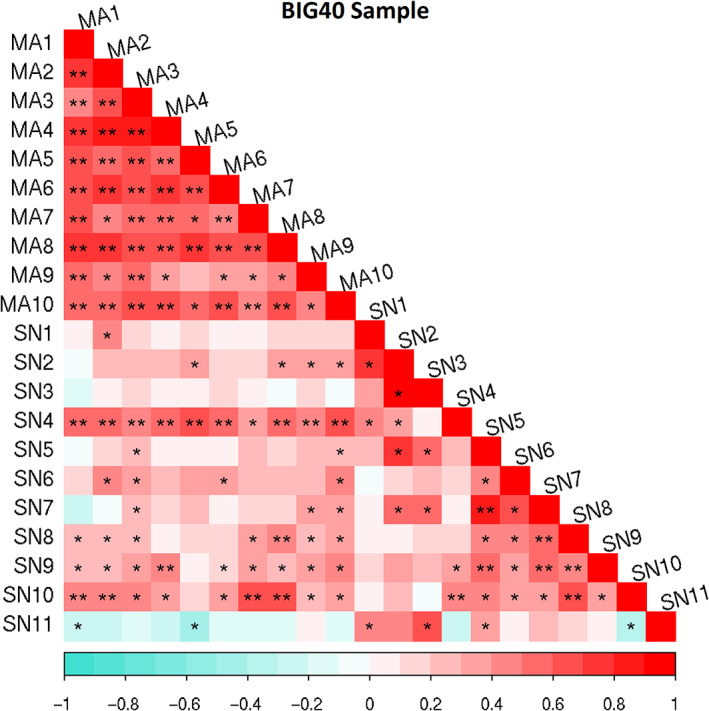
FIGURE 2.

Genetic correlation matrix of the heritable RSN amplitudes. Genetic correlations results are reported for the BIG40 samples. Multimodal association (MA) and sensory (SN) network amplitudes are represented according to the color bar displayed below. Genetic correlations scoring nominal and Bonferroni‐corrected significance are respectively labeled with * and **. RSN, resting state network
