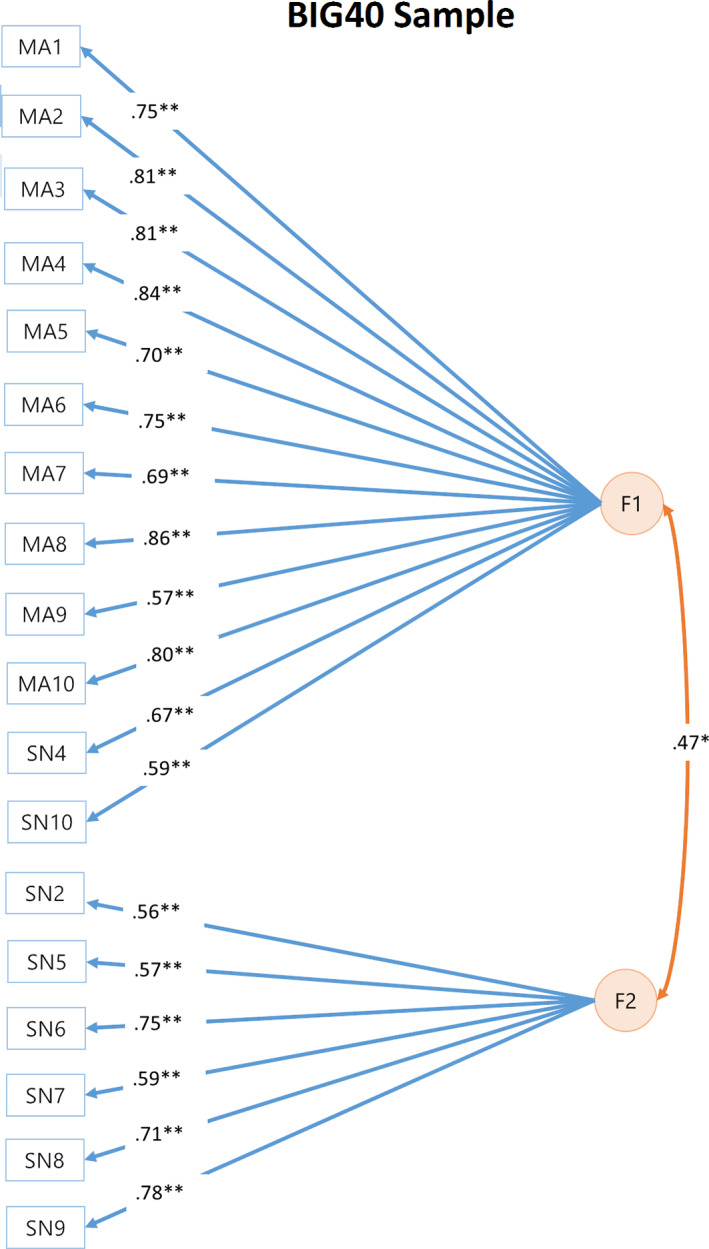
FIGURE 4.

Path diagram of two‐factor models reported for the BIG40 sample. Orange circles represent the two latent genetic factors of the two‐factor confirmatory factor analysis (CFA). Factor 1 (F1) and 2 (F2) are connected by a double‐headed arrow, which represents the correlation between the two factors. F1 and F2 are associated with RSNs represented by blue rectangles, with loadings represented by a blue arrow. Factor correlation and loadings reaching nominal and Bonferroni‐corrected significance (p[Bonferroni] ≤ .05/22 = .0022) are indicated respectively by * and **. RSN, resting state network
