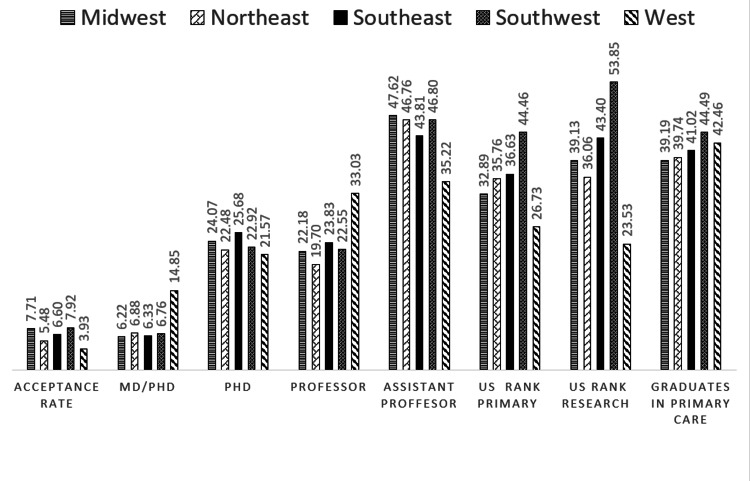
Figure 3. Distribution of academic institutional characteristics of medical schools by United States regions.
Values are from AAMC Faculty Roster Benchmark Report and are in percentages.
* One-way analysis of variance (ANOVA) was used to determine statistically significant differences. All the distributions above were statistically significant with p<0.001, except for US rank primary p=0.029
Acceptance Rate: Percentage of applicants admitted to the medical school.
US rank primary: US News & World Report ranking in primary care with 1 and a lower number being the most desirable.
US rank research: US News & World Report ranking in research with 1 or a lower number being the most desirable.
Grade point average (GPA): Median undergraduate GPA
Medical College Admission Test (MCAT): Median MCAT total score

