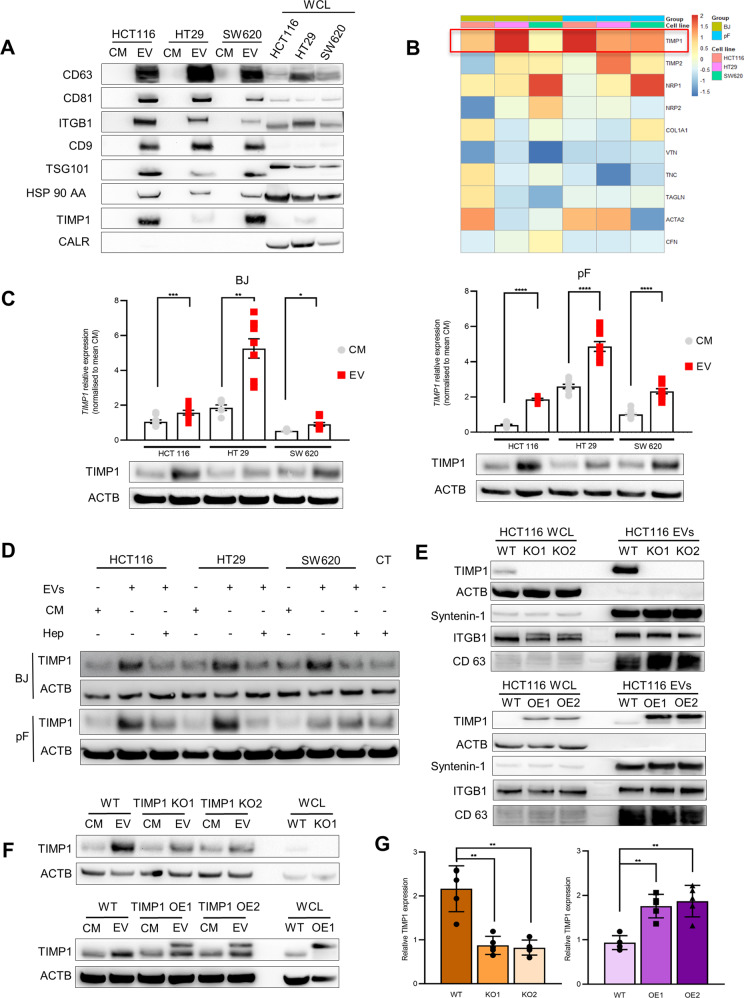
Fig. 2. TIMP1EV regulate TIMP1 levels in recipient fibroblasts.
A Immunoblot analysis of EV proteins CD63, CD81, ITGB1, CD9, TSG101, HSP90AA, TIMP1, and calreticulin as negative control in CM and EV fractions in 3 CRC cell lines. Whole-cell lysate (WCL) used as internal control. B Heat map of qPCR data illustrating differential expression pattern of various ECM genes in BJ and pF fibroblasts treated with CRC-EVs for 24 h. Values were normalised to CM controls. C TIMP1 mRNA levels in CM and EV treated fibroblasts (BJ and pF) (top) and corresponding TIMP1 protein levels (bottom). D Immunoblot of TIMP1 protein levels in BJ (top) and pF (Bottom) cells after 48 h CRC-EV and CM treatment and after a preceded heparin treatment (100 μg/ml) for 3 h. E Immunoblot showing TIMP1 expression in WCL and EV fraction derived from HCT116 TIMP1KO clones (KO1 and KO2) (top) and HCT116 TIMP1OE clones (OE1 and OE2) (bottom). Parental HCT116 cells (TIMP1WT) used as reference. ACTB and EV markers ITGB1, Syntenin1, and CD63 were used as loading controls. F Immunoblot analysis of TIMP1 expression in pFs treated with CM and EVs from TIMP1WT, TIMP KO1 and TIMP1 KO2 cells (top) and TIMP1WT, TIMP OE1, and TIMP1 OE2 cells (bottom). Beta-actin (ACTB) was used as a loading control. G Densitometry quantification of TIMP1 protein expression normalised to ACTB shown in (G) using imageJ. All experiments have been performed at least 3 times. Error bars depict mean ± SEM. P values were calculated by unpaired t-test: *p < 0.05, **p < 0.01, ***p < 0.001, ****p < 0.0001.

