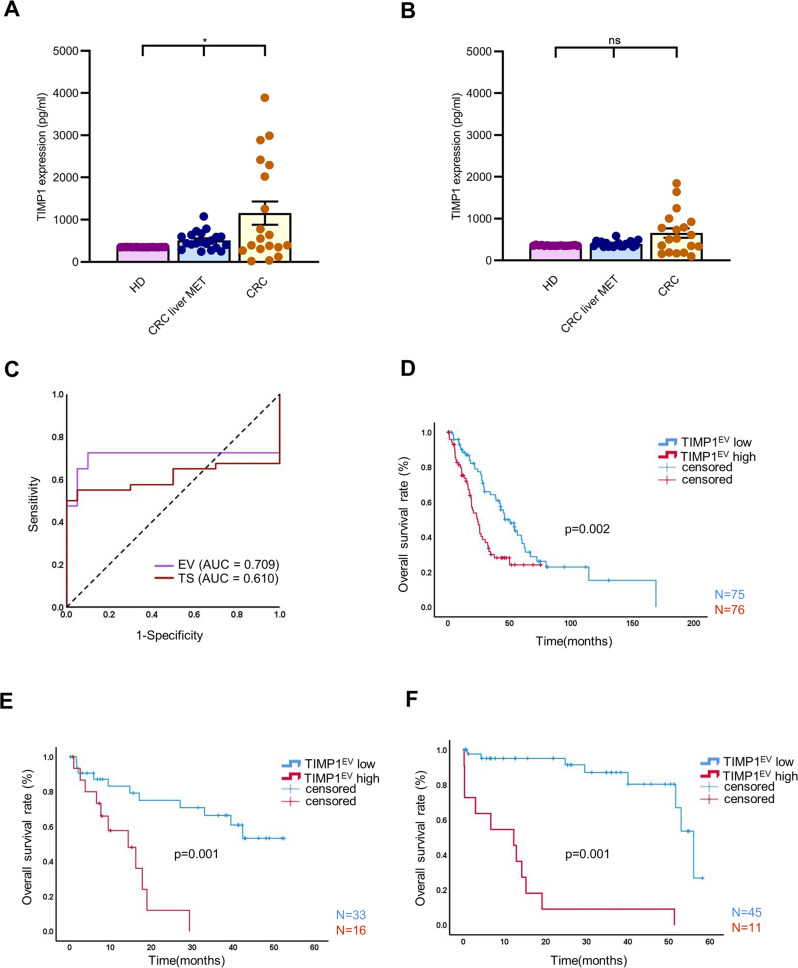
Fig. 4. TIMP1EV predicts poor clinical outcomes in patients with CRC liver MET.
A TIMP1 abundance in serum EVs from healthy donors (HD), CRC liver MET and CRC detected by ELISA (n = 20 per group). B TIMP1 abundance in the corresponding serum from healthy donors (HD), CRC liver MET and CRC detected by ELISA (n = 20 per group). C Receiver operating characteristic (ROC) curves showing superior stratification power of TIMP1EV (AUC = 709) compared to total serum TIMP1 levels (AUC = 0.610). D Kaplan-Meier curve of overall survival of patients with high or low TIMP1EV based on the estimated median TIMP1EV value in the discovery cohort. E, F Kaplan-Meier curve of overall survival of patients with high or low TIMP1EV in validation cohort I (E) and Validation cohort II (F) based on the cut-off value of the TIMP1EV estimated from the discovery cohort. P values were calculated by one-way ANOVA test (A, B) and log-rank test (D, E, and F). Error bars depict mean ± SEM. *p < 0.05, ns not significant.

