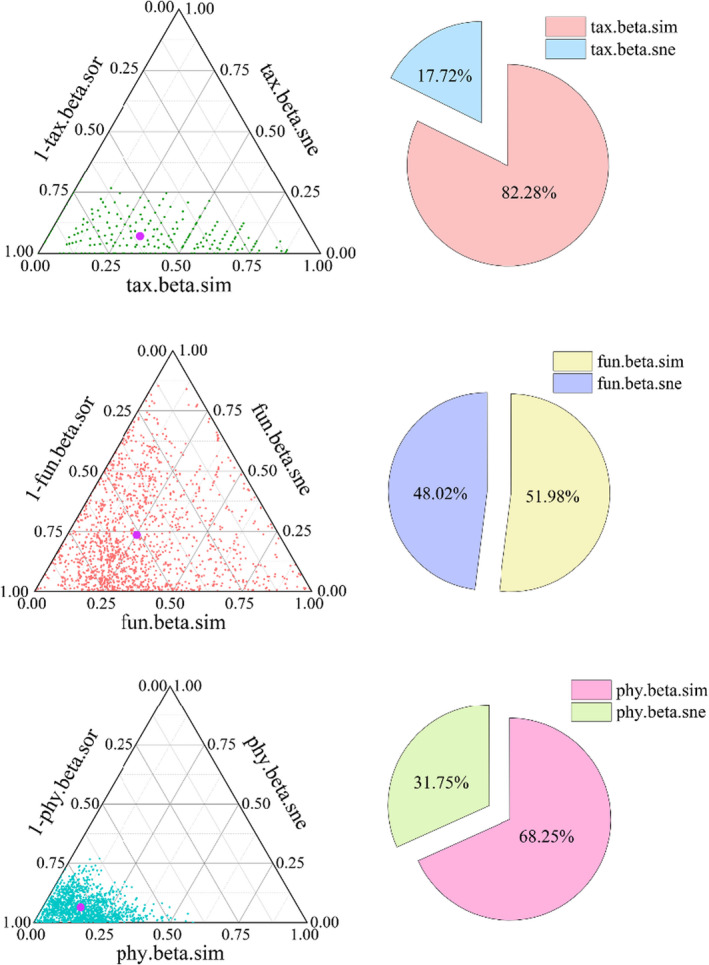
FIGURE 4.

The patterns and proportion of species, function, and phylogenetic β‐diversity components of desert plants. Note: Each green, red, and blue dot represent a pair of sites in triangular plots. Their positions were determined by a triplet of values from the species, functional and phylogenetic composition similarity (1‐taxa.beta.sor, 1‐fun.beta.sor, and 1‐phy.beta.sor, respectively), tax.beta.sor: species β‐diversity, tax.beta.sim: species turnover component; tax.beta.sne: species nestedness component; fun.beta.sor: functional β‐diversity, fun.beta.sim: functional turnover component; fun.beta.sne: functional nestedness component; phy.beta.sor: phylogenetic β‐diversity, phy.beta.sim: phylogenetic turnover component; phy.beta.sne: phylogenetic nestedness component, each triplet sums to 1. The larger purple dots represent the mean values of the three components in all pair of sites
