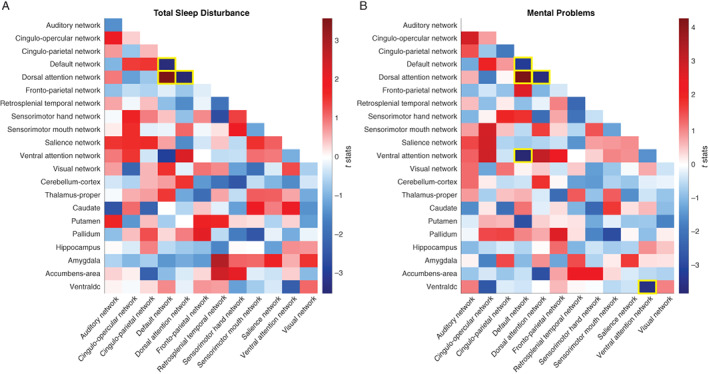
FIGURE 1.

The associations between network connectivity measures and total sleep disturbance/mental problems. (a) The association between network connectivities and total sleep disturbance. Color bar represents t‐stats. That is, red/blue means positive/negative association between total sleep disturbance and network connectivity measures, respectively. Only unique network connectivity measures were shown in the matrix (i.e., top right was intentionally left blank). Yellow outlines denote network connectivity that survived FDR correction (p < .05 FDR corrected) for multiple comparisons out of 186 unique comparisons. (b) The association between network connectivities and mental problems. Color bar represents t‐stats. That is, red/blue means positive/negative association between mental problems and network connectivity measures, respectively. Yellow outlines denote network connectivity that survived FDR correction (p < .05 FDR corrected) for multiple comparisons out of 186 unique comparisons. Ventraldc, ventral Diencephalon
