FIGURE 3.

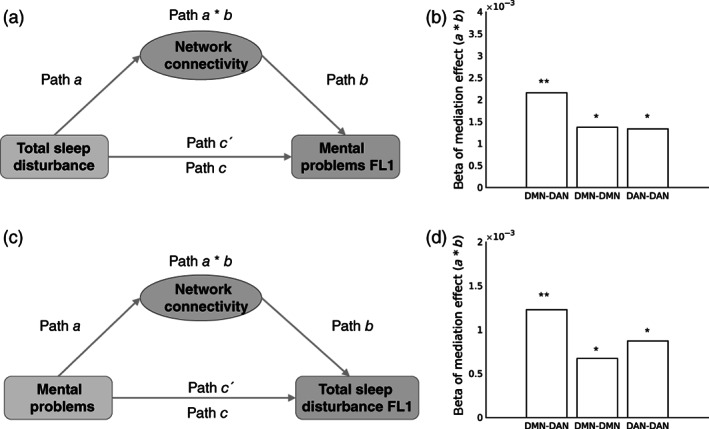
Network connectivities mediated both the relationship between total sleep disturbance (at baseline) and mental problems (at 1‐year follow‐up, FL1) (a and b) and the relationship between mental problems (at baseline) and total sleep disturbance (at FL1) (c and d). (a) Diagram of the first set of mediation models. These models test whether identified network connectivities (DMN‐DAN, DMN‐DMN, and DAN‐DAN) mediated the effect of TSD on MP at FL1. (b) Bar graph of mediation effects of the three network connectivities in the first set of mediation models. All beta of path a * b was significant (all p < .05). (c) Diagram of the second set of mediation models, these models test whether identified network connectivities (DMN‐DAN, DMN‐DMN, and DAN‐DAN) mediated the effect of MP on TSD at FL1. (d) Bar graph of mediation effects of the three network connectivities in the second set of mediation models. All beta of path a * b was significant (all p < .05). Each longitudinal mediation analysis controlled for the corresponding baseline data of the dependent variable, for example, for diagram A, baseline mental problems was added as a covariate. *p < .05; **p < .01. DAN, dorsal attention network; DMN, default mode network; MP, mental problems; TSD, total sleep disturbance
