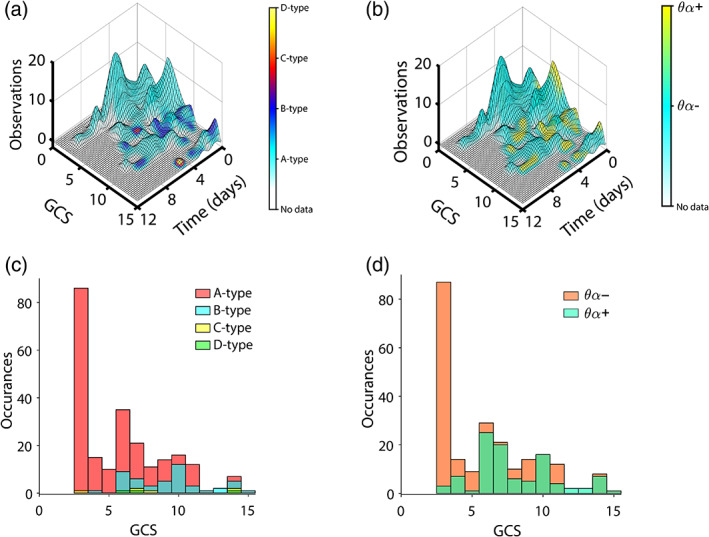
FIGURE 2.

Surface plots and histograms of EEG types. Time is referenced to the earliest time with EEG for each patient (a,b). (a) Number of EEG observations (height of surface plot) and ABCD type (color) across all patients as a function of time and GCS score. Note that low GCS trajectories do not evolve beyond A‐type. (b) Number of EEG observations (height of surface plot) and θα type (color) across all patients as a function of time and GCS score. Note that low GCS trajectories do not evolve beyond θα−. (c) Histogram of GCS scores across all patients' EEG observations color‐coded by ABCD type. (d) Histogram of GCS scores across all patients' EEG observations color‐coded by θα type
