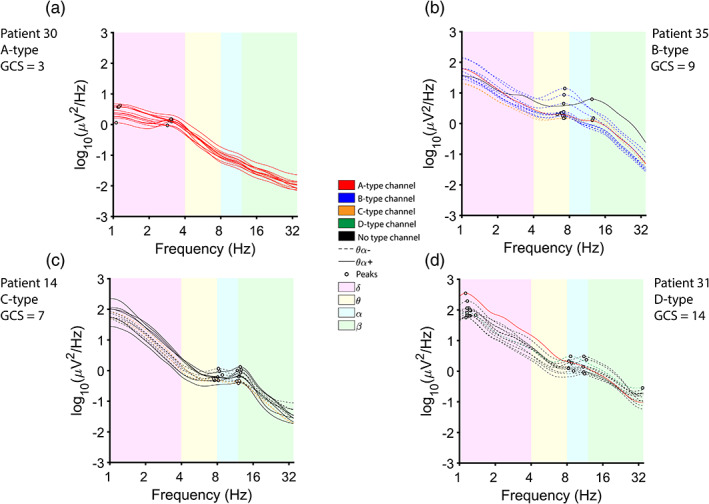
FIGURE 3.

Examples of ABCD model types. Power spectral densities (PSDs) from each channel are color‐coded according to their ABCD type; unclassifiable channels are colored black. Peaks detected for classification are indicated with circles. Channels with a θα peak are dashed. Shaded areas are colored according to frequency band. (a) A‐type EEG corresponding to a GCS score of 3. All channels were categorized as A‐type, and peaks were only present in the delta band. (b) B‐type EEG corresponding to a GCS score of 9. In total, one channel was categorized as A‐type, nine channels as B‐type, two channels as C‐type, and one channel as unclassifiable (due to the presence of a beta peak without an accompanying theta or alpha peak). Eleven channels showed a θα peak. (c) C‐type EEG corresponding to a GCS score of 7. In total, two channels were categorized as C‐type, and the remaining nine channels were uncategorizable. Seven channels showed θα peaks. (d) D‐type EEG corresponding to a GCS score of 14. In total, one channel was categorized as A‐type, one channel as D‐type, and the remaining nine channels were uncategorizable. Because D‐type is a more progressive type than A‐type, the tie between A‐type and D‐type (one channel each) is broken by D‐type. Twelve channels showed a θα peak
