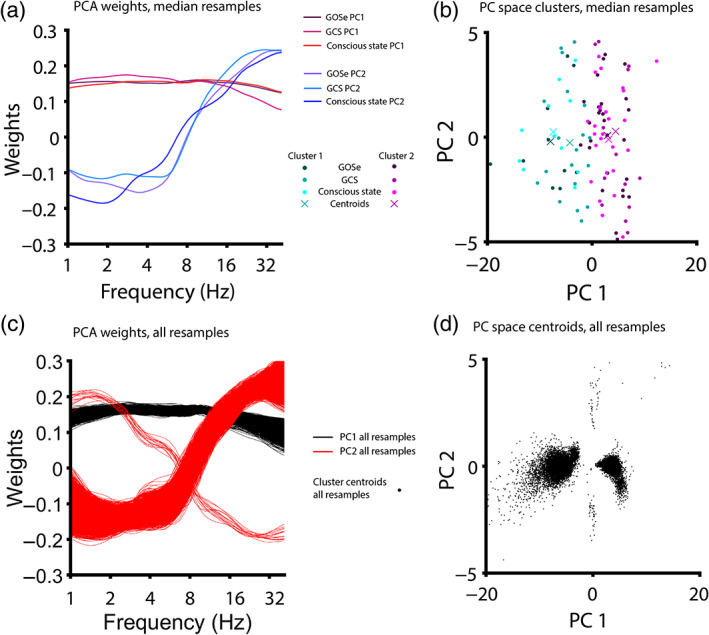
FIGURE 4.

Principal component weights and clusters from resampling. Most patients (36/38, 94.7%) had multiple usable EEG observation (Table 2, mean number of EEG observations per patient = 8.4). We therefore used resampling (N = 9,999 resamples) to draw one EEG observation per patient for clustering in principal components (PC) space (so that clusters are not weighted more heavily toward patients with more observations). For each model, the resample yielding the median t‐statistic was selected. (a) PCA weights yielded from the median resample for each model. PCA was performed on channel‐averaged and log‐scaled EEG power spectra to cluster patients in PC space. For each model (predicting Glasgow Outcome Scale extended/GOSe, Glasgow Coma Scale/GCS or conscious state), the first PC reflected the overall EEG power (i.e., a roughly equal weighing of power across all frequencies; variance explained: 75.4%, GCS and 74.9%, GOSe) and the second PC reflected power at high frequencies (variance explained: 15.2%, both models). (b) PC space clusters and cluster centroids for each model. For all models, clusters were separated along the first PC, with the second PC accounting for most within‐cluster variance. Cluster membership was then entered as a predictor into regression models. (c) PCA weights shown for all 9,999 resamples. (d) PC space cluster centroids shown for all 9,999 resamples
