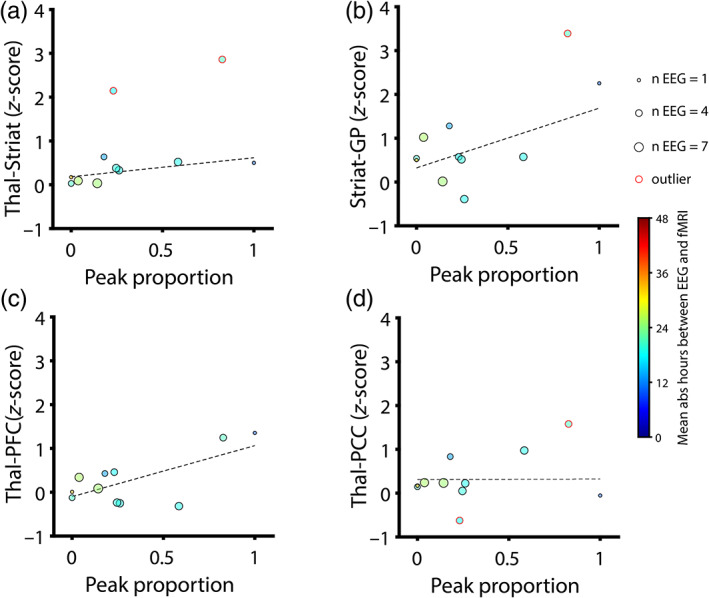
FIGURE 5.

Correlations of EEG (proportion of channels with θα peak or “peak proportion”) with fMRI connectivity. Peak proportion was averaged across all usable EEG observations within 48 hr of MRI. Data points are sized proportionally to the number of averaged EEG observations and colored according to the mean hours elapsed between EEG and MRI (absolute value, warmer colors indicate greater mean time elapsed). Outliers (>3 scaled median absolute deviations from the median of either variable) are indicted with red circles around data points and were excluded from analysis. Dotted black lines represent the least‐squares linear fit for included data points. We corrected for testing across four region of interest (ROI) pairings using false discovery rates (FDR). Correlations are reported as Pearson coefficients. (a) Peak proportion versus z‐scored thalamo‐striatal connectivity: r = .63, p = .10, FDR corrected (uncorrected: p = .07). Note the presence of two excluded outliers. (b) Peak proportion versus z‐scored striatal‐pallidal connectivity: r = .59, p = .10, FDR corrected (uncorrected: p = .07). Note the presence of one excluded outlier. (c) Peak proportion versus z‐scored thalamo‐prefrontal cortical (PFC) connectivity: r = .68, p = .08, FDR corrected (uncorrected: p = .02). (d) Peak proportion versus z‐scored thalamo‐posterior cingulate cortical (PCC) connectivity: r = .01, p = .97, FDR corrected (uncorrected: p = .97). Note the presence of two excluded outliers
