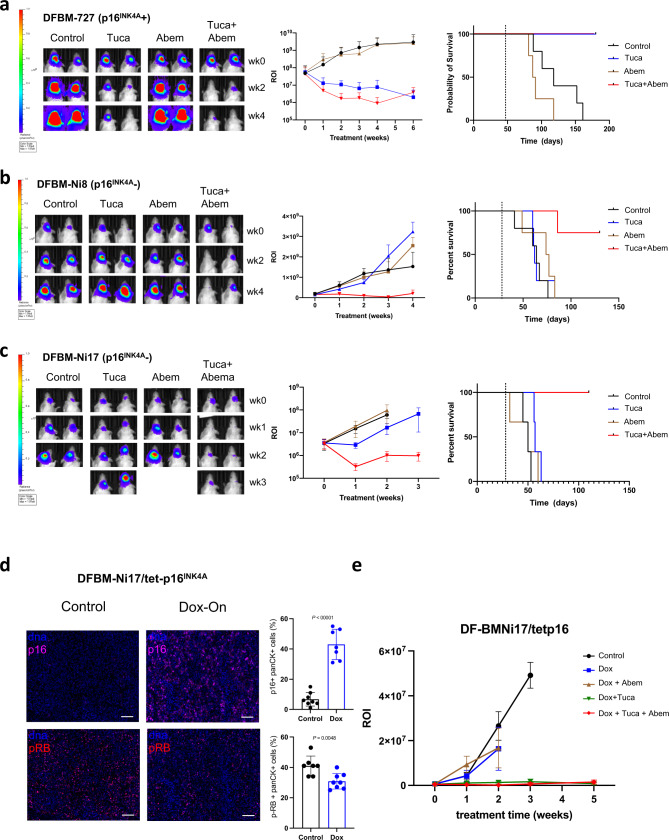
Fig. 3. Loss of p16INK4A is sufficient to predict response to tucatinib + abemaciclib in HER2 + BCBM PDX models.
a Bioluminescence imaging (BLI) analysis with ROI of mice bearing DFBM-727 (p16INK4A positive) tumors at indicated weeks after treatment with control, tucatinib (PO 75 mg/kg, BID), abemaciclib (PO 75 mg/kg, QD), or Tuca + Abem. Left panel: representative bioluminescence images. Middle panel: quantification of the regions of interest (ROI) in each group mice at indicated imaging time points, Vehicle control (n = 5), Tucatinib (n = 4), Abemaciclib (wk0-4, n = 4; wk6, n = 2) or Tuca + Abem (n = 5). Mean ± SD. Right panel: Kaplan–Meier survivals of mice bearing DFBM-727. Dotted lines indicate treatment starting time. b BLI and survival analysis for DFBM-Ni8 (p16INK4A IHC negative, CDKN2A CNV = 1) treated as in a. BLI right panel: Vehicle control (wk0,1 n = 5; wk2,3, n = 4; wk4, n = 3), Tucatinib (n = 5), Abemaciclib (wk0-3, n = 4; wk4, n = 3) or Tuca + Abem (wk0-2, n = 5; wk3,4, n = 4). Mean ± SEM. c BLI and survival analysis for DFBM-Ni17 (p16INK4A IHC negative, CDKN2A CNV = 2) treated as in a. BLI right panel: Vehicle control (n = 3), Tucatinib (n = 3), Abemaciclib (wk0, n = 3; wk1,2, n = 2), or Tuca + Abem (n = 3). Mean ± SEM. d Multiplex immunofluorescence shows increase in p16INK4A (control, n = 8 sections; Dox, n = 7 sections) and reduction in p-RB (control, n = 7 sections; Dox, n = 8 sections) after 3 days of doxycycline administration to DFBM-Ni17/tetp16INK4A. Mean ± SD, Unpaired t-test. e BLI analysis with ROI of mice bearing DFBM-Ni17/tetp16INK4A tumors at the indicated time with the treatment as indicated. Tucatinib (PO 75 mg/kg, BID), abemaciclib (PO 75 mg/kg, QD), doxycycline-diet (2500 ppm, ScottPharma). Control (n = 4), Dox (n = 4), Dox + Abem (n = 4), Dox + Tuc (wk0-3, n = 5; wk5, n = 4), Dox + Tuc + Abem (wk0-1, n = 5; wk2-5, n = 4). Mean ± SD. Source data are provided as a Source Data file.

