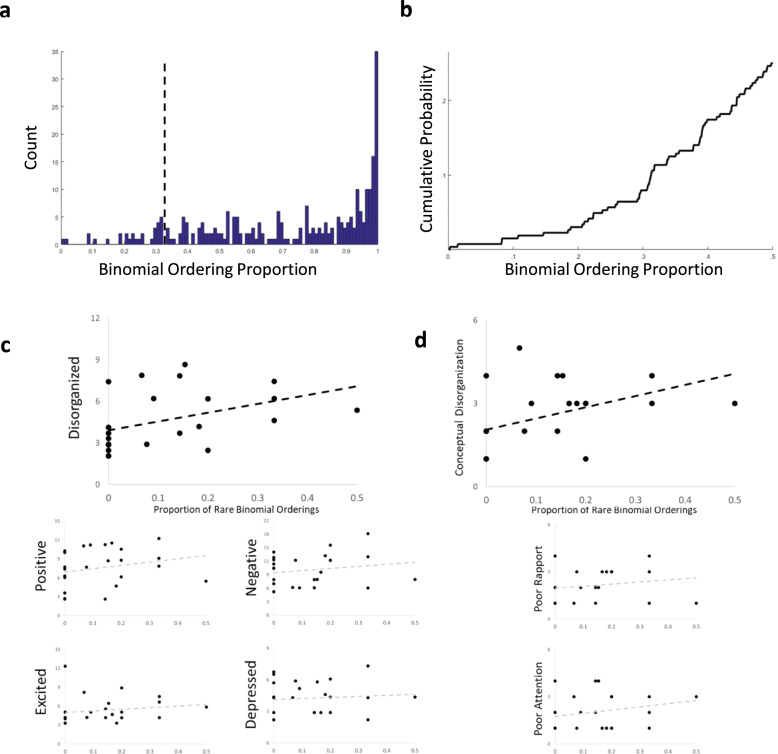
Fig. 1. Rare binomials are associated with thought disorder.
a A histogram of the binomial ordering preference for all binomials across all subjects. The dotted line is at 0.33 and all binomials to the left of this line were considered to be rare binomials. b The cumulative probability of all binomial ordering preferences (up to 0.5) across all subjects. c Scatter plots between number of rare binomials, normalized by total number of binomials per transcript, and the factor scores. Only the black trendline (Disorganized Factor) is a statistically significant association. d Scatter plots showing the relationships between normalized rare binomial count and the three component PANSS items of the Disorganized Factor score. Only the Conceptual Disorganization item shows a statistically significant relationship.

