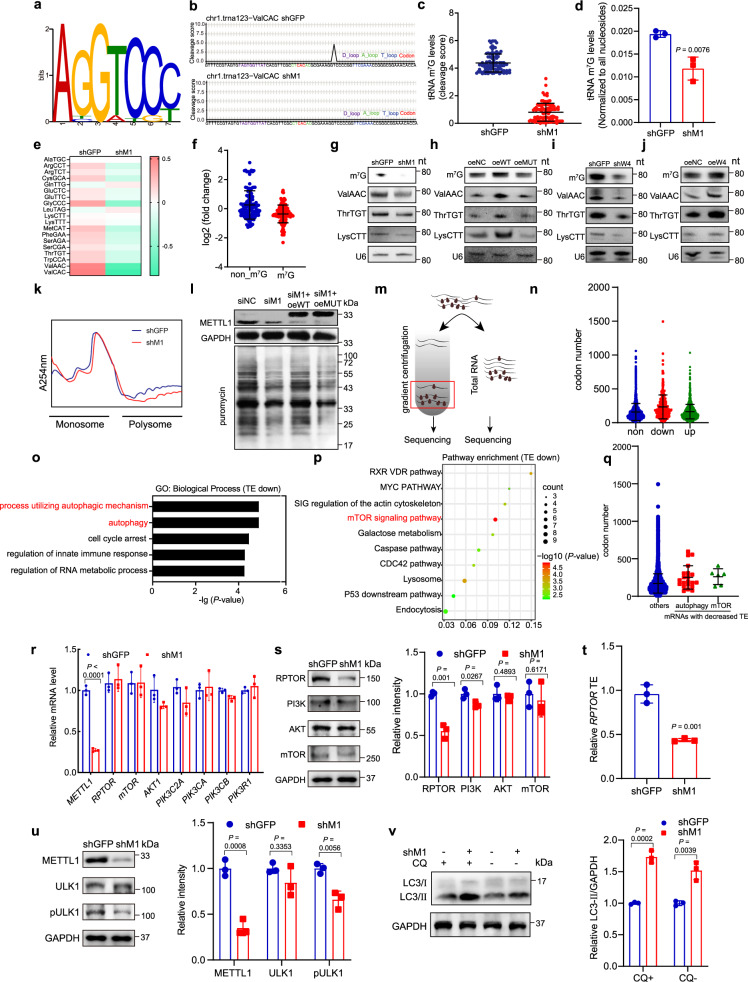
Fig. 3. METTL1 regulates tRNA m7G modification, tRNA expression, and oncogenic mRNA translation.
a Motif sequence at m7G site. b Representative image of cleavage score. c Quantification of m7G level on m7G-modified tRNAs. d LC-MS-based detection of m7G tRNA modification levels on tRNAs. e Expression profile of m7G-modified tRNAs in the METTL1 knockdown and control cells. Each cell shows the relative expression of all isodecoders of a specific tRNA type. Expression of each tRNA type was normalized by its overall average level in both groups and transformed by log2. f Mann–Whitney U test on the expression of the m7G-modified and non-m7G tRNAs. g–j Northern blot of indicated tRNAs. U6 snRNA was used as a loading control. k Polysome profiling of METTL1 depleted and control K150 cells. l Puromycin intake assay of K150 cells. m Schematic of polyribosome-seq. n The numbers of m7G tRNA-decoded codons in mRNAs with upregulated TEs (up), downregulated TEs (down), and unaltered TEs (non) in the METTL1 depleted cells. o Gene ontology analysis using the TE-down genes. p Pathway analysis using the TE-down genes. q m7G tRNA-decoded codon numbers in TE-decreased mRNAs enriched in the negative regulation of autophagy or mTOR signaling pathway and other mRNAs. r qRT-PCR analysis of representative genes in K150 cells. s Western blot analysis of indicated proteins in K150 cells, right panel: quantification of the western blot signals. t qRT-PCR based TE analysis of RPTOR using the polyribosome mRNAs. u Western blot analysis of ULK1 and pULK1 in K150 cells, right panel: quantification of the western blot signals. v Western blot analysis of LC3 in K150 cells, right panel: quantification of the western blot signals. Data presented as mean ± SD from two independent biological samples for each group for (c, e, and f), three independent biological samples for (d), one biological sample for (n, q), and three independent experiments for (r–v). P values are calculated by Mann–Whitney U test for (c, f, n, and q), and two-tailed unpaired Student’s t test for (d, r, s, t, u, and v). Source data are provided as a Source data file.

