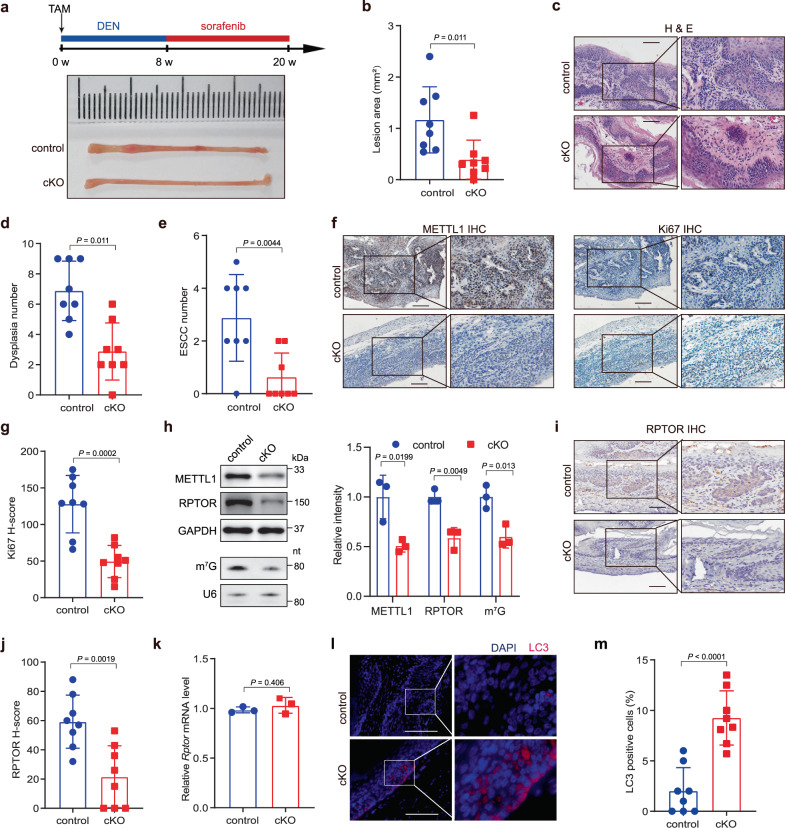
Fig. 5. Knockout of Mettl1 inhibits in vivo ESCC tumorigenesis.
a Experimental design for ESCC tumorigenesis model and the representative images of esophageal lesions from Mettl1 cKO and control mice. b Quantification of lesion areas in Mettl1 cKO and control mice. c Representative H&E staining of esophagus tissues in Mettl1 cKO and control mice. Scale bar, 100 μm. d Quantification of dysplasia numbers in Mettl1 cKO and control mice. e Quantification of ESCC numbers in Mettl1 cKO and control mice. f, g Representative images of METTL1 and Ki67 IHC staining (f) and the quantification of Ki67 H-scores (g) in Mettl1 cKO and control mice. Scale bar, 100 μm. h Western blot analysis and northwestern blot analysis showed the m7G modification level and indicated protein levels, right panel: quantification of the blot signals, n = 3 biological independent samples for each group. i, j Representative images (i) and the quantification of H-scores (j) of RPTOR IHC staining in Mettl1 cKO and control mice. Scale bar, 100 μm. k qRT-PCR analysis of Rptor mRNA level in cKO and control mice, n = 3 biological independent samples for each group. l, m IF assay (l) and the quantification (m) of LC3 levels in Mettl1 cKO and control mice. Scale bar, 100 μm. Data represented as mean ± SD by two-tailed unpaired Student’s t test for all. n = 8 mice for each group for (a–g, i, j, and l, m).

