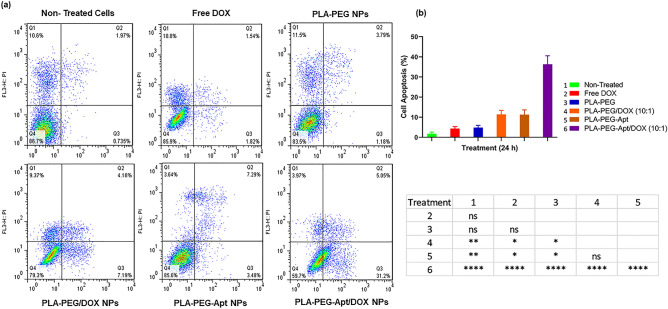
Figure 7.
Cellular apoptosis. (a) Flow cytometry histograms of A-549 cells treated with Free DOX, PLA-PEG NPs, PLA-PEG/DOX NPs, PLA-PEG-Apt NPs, and PLA-PEG-Apt/DOX NPs for 24 h using Annexin V-FITC/PI staining (Q1: dead cells with Annexin V-FITC (−)/PI (+), Q2: late apoptotic cells with Annexin V-FITC (+)/PI (+) Q3: live cells with AnnexinV-FITC (−)/PI (−), Q4: early apoptotic cells with Annexin V-FITC (+)/PI (−)). (b) The number of apoptosis cells was counted with a FACS Calibur flow cytometer for A-549 cells (P-value: ns is not-significance (≥ 0.05). * is significant between 0.01 and 0.05., ** is significant between 0.001 and 0.01., and ****, significant < 0.0001).

