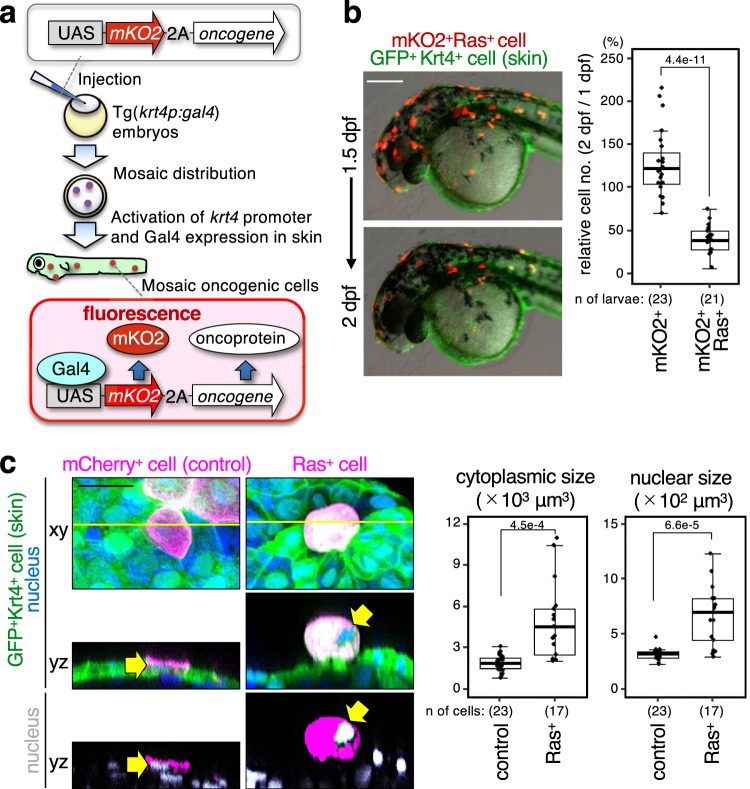
Fig. 1. Newly generated RasG12V cell surrounded by normal cells is eliminated from zebrafish epithelia.
a Schematic illustration of experimental introduction of fluorescent oncogenic cells in zebrafish larval skin in a mosaic manner through the Gal4/UAS system. b Mosaic RasG12V cell disappears from larval skin. Representative images show the larvae with mosaically introduced cells expressing mKO2 with RasG12V (mKO2+Ras+ cells) (red). Skin cells were visualised with krt4p:gal4; UAS:EGFP (green). Scale bar: 200 μm. Bottom box plots of relative mKO2+ cell number of 2 days postfertilisation (dpf)/1 dpf ratio show first and third quartile, median is represented by a line, whiskers indicate the minimum and maximum, and outliers are shown as dots outside of the box. Each dot represents one larva. Unpaired two-tailed t-test was used. Note that oncogenic cells were introduced not only to the head region but also to the trunk and tail regions, and their disappearance occurred in all areas. c Cytoplasmic and nuclear swelling occurs in mosaic RasG12V cells. Representative confocal images show mosaic mCherry+ (control) or mCherry+RasG12V (Ras+) cells (magenta) and nucleus (upper; blue, lower; grey) in the larvae. Arrows indicates nuclei of mCherry+ cells. Scale bar: 20 μm. Box plots of estimated nuclear or cytoplasmic size (μm3) show first and third quartile, median is represented by a line, whiskers indicate the minimum and maximum, and outliers are shown as dots outside of the box. Each dot represents one cell. Unpaired two-tailed t-test was used. Source data are provided as a Source Data file.

