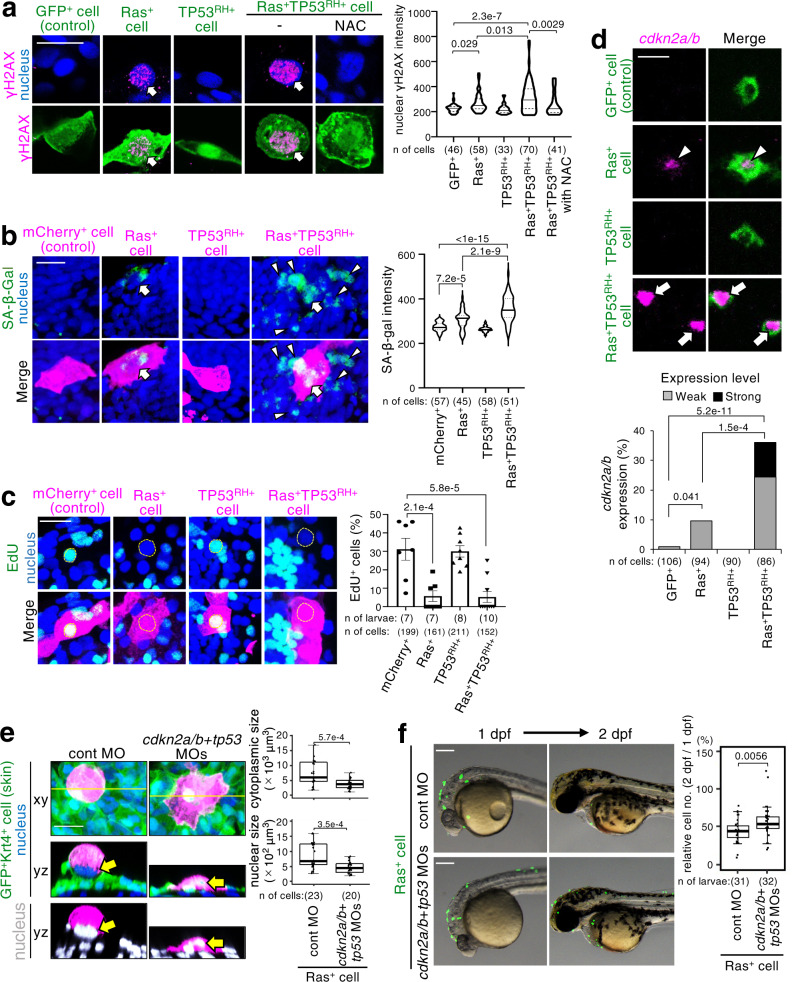
Fig. 2. Newly generated oncogenic cells undergo cellular senescence.
a–d Representative confocal images show cells with GFP (a, d) or mCherry (b, c) alone (control), or with RasG12V, TP53R175H, or RasG12V and TP53R175H (GFP+, mCherry+, Ras+, TP53RH+, or Ras+TP53RH+ cells) (green in a, d, magenta in b, c). Scale bar: 20 μm. In a, arrows indicate γH2AX (magenta)-accumulated GFP+ oncogenic cells. Violin plots of γH2AX intensities in GFP+ cells show 75th, 50th (median), and 25th percentiles. In b, SA-β-gal was visualised by SPiDER-βGal (green). Arrowheads indicate SA-β-gal-expressing mCherry+ oncogenic cells, and arrows indicate cells SA-β-gal-expressing neighbouring cells. Violin plots of SA-β-gal intensities in mCherry+ cells show 75th, 50th (median), and 25th percentiles. In c, EdU+ cells (green) were observed in mCherry+ or TP53RH+ cells, but not Ras+ or Ras+TP53RH+ cells (magenta). Yellow broken lines: nuclei of mCherry+ cells. Bar plots show EdU+mCherry+ cells (mean ± SEM). Each dot represents one larva. A two-tailed one-way ANOVA test with Sidak correction (a, b, c) was used. In d, fluorescent in situ hybridization visualised cdkn2a/b mRNA (magenta). Arrows or arrowheads indicates cells expressing cdkn2a/b weakly or strongly, respectively. Bottom graphs show percentages of GFP+ cells with weak or strong cdkn2a/b expression. Fisher’s exact test with Bonferroni correction was used. e Representative confocal images show cells expressing mKO2+RasG12V (Ras+) (magenta) and nucleus (upper: blue, lower: grey). Skin cells visualised with krt4p:gal4; UAS:EGFP (green). Scale bar: 20 μm. Box plots of estimated nuclear or cytoplasmic size (μm3) show first and third quartile, median is represented by a line, whiskers indicate the minimum and maximum. Each dot represents one cell. Unpaired two-tailed t-test was used.f Representative images show larvae with GFP+RasG12V (Ras+) cells (green) with control MO or cdkn2a/b + tp53 MOs. Scale bar: 200 μm. Box plots of relative Ras+ cell number between 2/1 dpf ratio show first and third quartile, median is represented by a line, whiskers indicate the minimum and maximum, and outliers are shown as dots outside of the box. Each dot represents one larva. Unpaired two-tailed t-test was used. Source data are provided as a Source Data file.

