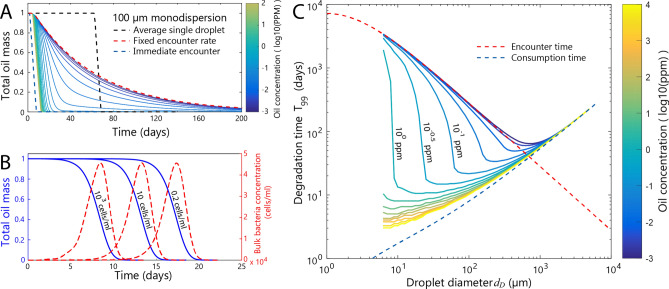
Figure 3.
Degradation of monodispersed oil droplets. (a) The degradation of a single average droplet (black dashed line) overemphasizes the initial lag time and the suddenness of the degradation in comparison to the stochastic degradation of a dispersion of oil droplets. For a given droplet size (here, 100 µm diameter), the initial oil concentration (colormap) determines the extent of enrichment in the bulk bacterial concentration, which influences the overall degradation time. At very low oil concentrations (blue solid lines), the degradation of a monodispersion approaches an exponential decay limit of non-interacting droplets (red dashed line), for which the bulk bacterial concentration remains at its initial value. At high initial oil concentrations (yellow solid lines), the degradation is rapid and linear due to a large increase in bulk bacterial concentration, but delayed relative to the hypothetical case in which all droplets begin in an encountered state (blue dashed line). (b) The time course of the total oil mass for 20 µm diameter droplets at an initial oil concentration of 1 ppm (blue) and the bulk bacterial concentration (red) are given for three initial bacterial concentrations: 103, 10, and 0.2 cells/ml. The initial background bacterial concentration alters the initial lag in the response, but the degradation curves and bacterial concentration profiles remain remarkably similar. (c) Optimal droplet size for the biodegradation of a monodispersion. The time T99 to degrade a monodispersion of droplets, as a function of the droplets’ diameter, for different initial oil concentrations (colormap). The encounter time (red dashed line) is the time for 99% of the oil droplets to be independently encountered. The consumption time (blue dashed line) is the time it takes for 99% of the mass of a droplet to be degraded after the first encounter occurs.

