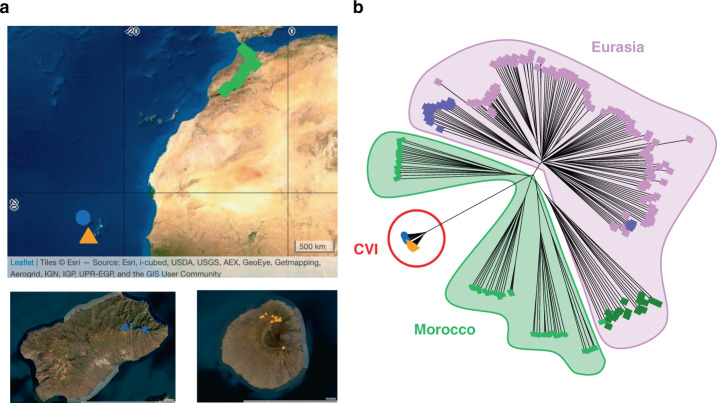
Fig. 1. Population structure of Cape Verde Arabidopsis.
a Sample locations of sequenced lines from Morocco (green, n = 64) and the Cape Verde Islands, Santo Antão (blue, n = 189) and Fogo (orange, n = 146). The base map used derives from the World Imagery Map117 and was accessed through the R package leaflet118. Values on the x-axis and y-axis represent, respectively, longitude and latitude. b Neighbour-joining tree showing relationship of CVI (n = 336, in blue and orange) to worldwide samples. Morocco: n = 64, in green; Eurasia: n = 180, including 20 samples, each from 9 representative clusters26. Divergent Iberian lines, or relicts, are shown in dark green, other Iberian lines (non-relicts) are shown in purple, and all other Eurasian lines in magenta. Source data are provided as a Source Data file.

