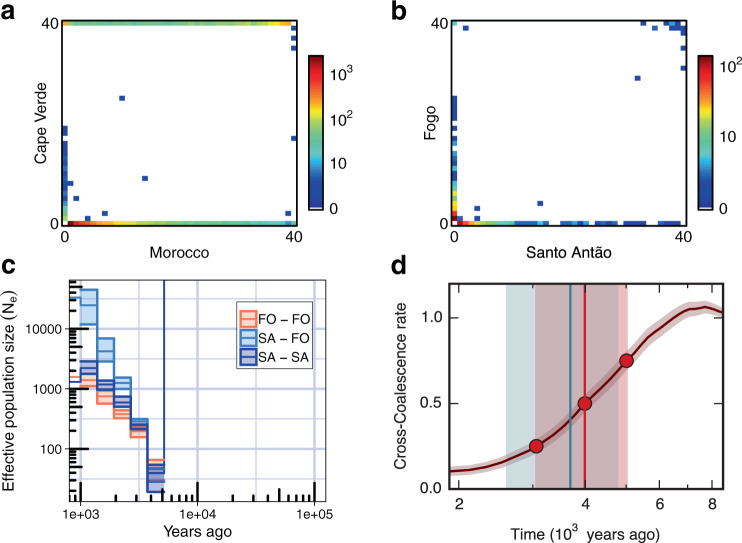
Fig. 2. Demographic history of Cape Verde Arabidopsis.
a Joint site frequency spectrum between Cape Verde and Morocco and, (b), between the two islands, Santo Antão and Fogo. The colour scale represents the number of variants in each frequency class. c Historical population size trajectories within (SA-SA, FO-FO) and between islands (SA-FO) inferred from RELATE. Shaded areas represent the 95% CI calculated from the genome-wide distribution of coalescence events. d Estimated split times between islands from MSMC-CCR (point estimate at the vertical red line (4.0 kya), 0.25–0.75 cross-coalescence rate quantiles shown as shaded red area (3.1–5.0 kya)), and dadi (point estimate at the vertical blue line (3.7 kya), 95% CI as shaded blue area (2.6–4.8 kya)). Source data are provided as a Source Data file.

